


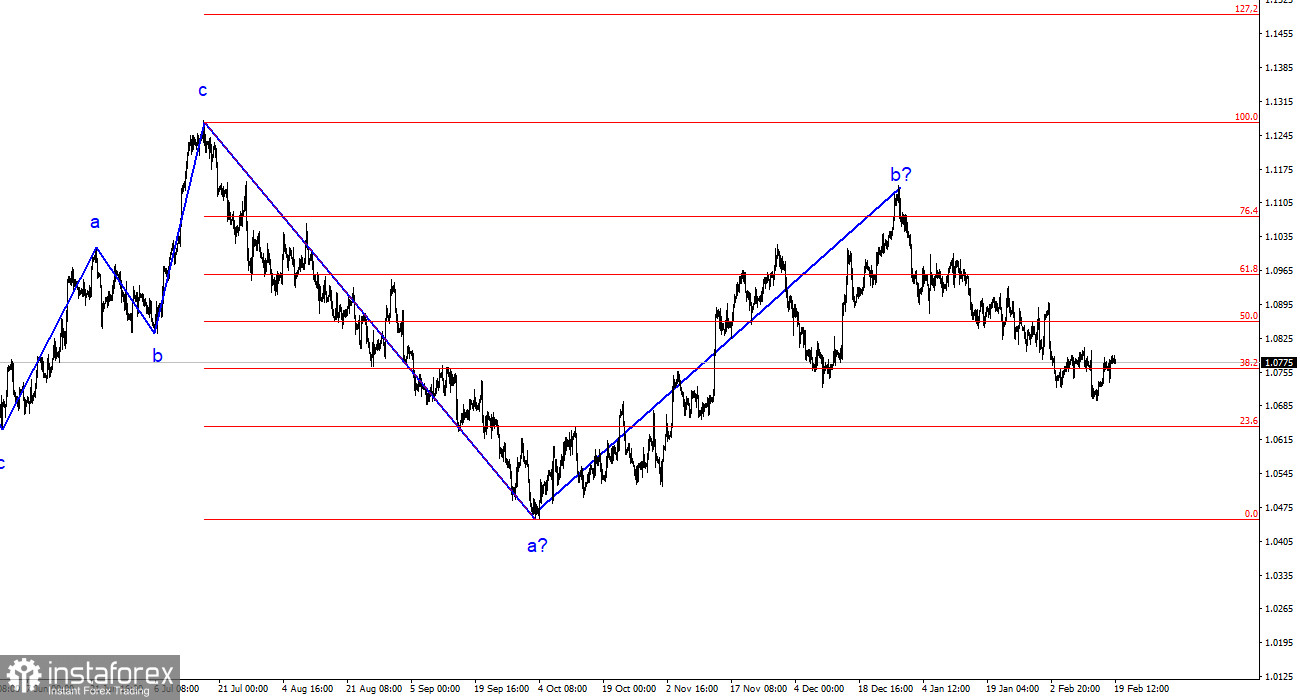
The wave analysis of the 4-hour chart for the EUR/USD pair remains unchanged. Over the past year, we have seen only three-wave structures constantly alternating with each other. At the moment, the construction of another three-wave structure continues – a downward one. The presumed wave 1 is completed, and wave 2 or b has complicated three or four times, but at the moment, it can still be considered conditionally completed, as the pair has been declining for more than a month.
The rising segment of the trend may still resume, but its internal structure will be unreadable in this case. I highlight unambiguous wave structures that do not tolerate double interpretation. If the current wave analysis is correct, the market has moved on to form wave 3 or c. A successful attempt to break through the level of 1.0788, corresponding to 76.4% Fibonacci, once again confirmed the market's readiness for sales. Now, the nearest target is the level of 1.0637, which is equivalent to 100.0% Fibonacci. However, I expect the euro's decline to be incomplete. Wave 3 or c should be much more prolonged in time and targets.
The decline in the euro may resume this week.
The exchange rate of the EUR/USD pair did not change on Monday. During the European and American sessions, no interesting event could cause market movements. America celebrated President's Day. All the stars aligned in favor of us, and we did not see any market movements. At the same time, the most important thing is not even the news background but the level of 1.0788, corresponding to 76.4% Fibonacci. A successful attempt to break through it will indicate the market's readiness to buy the pair. But I am counting on another option: an unsuccessful attempt to break through and a further decline in demand for the euro.
Since the news background will be very weak throughout the current week, we can see weak movements both up and down. Downward movements are more logical as the construction of a downward wave 3 or c continues, which should take on an extended form, like the two previous waves of the descending trend. However, to identify a new decline, a good signal is needed. An unsuccessful attempt to break through the level of 1.0788 may become such a signal. But a clear signal is needed to recognize the market sentiment. Even without a signal, it is clear that the euro should decline, as the wave analysis suggests. But to enter the market this week, a signal is needed.
General conclusions
Based on the analysis of EUR/USD, the construction of a downward wave set continues. Wave 2 or b has taken a completed form, so in the near future, I expect the continuation of the construction of an impulsive downward wave 3 or c with a significant decline in the pair. An unsuccessful attempt to break through the level of 1.1125, corresponding to 23.6% Fibonacci, indicated the market's readiness for sales a month ago. I consider only sales with targets around the calculated level of 1.0462, corresponding to 127.2% Fibonacci.
On a larger wave scale, the presumed wave 2 or b, which in length is already more than 61.8% Fibonacci from the first wave, may be completed. If this is indeed the case, then the scenario with the construction of wave 3 or c and a decline in the pair below the 4-figure mark has begun to be implemented.


