


EUR/USD 5M Analysis.
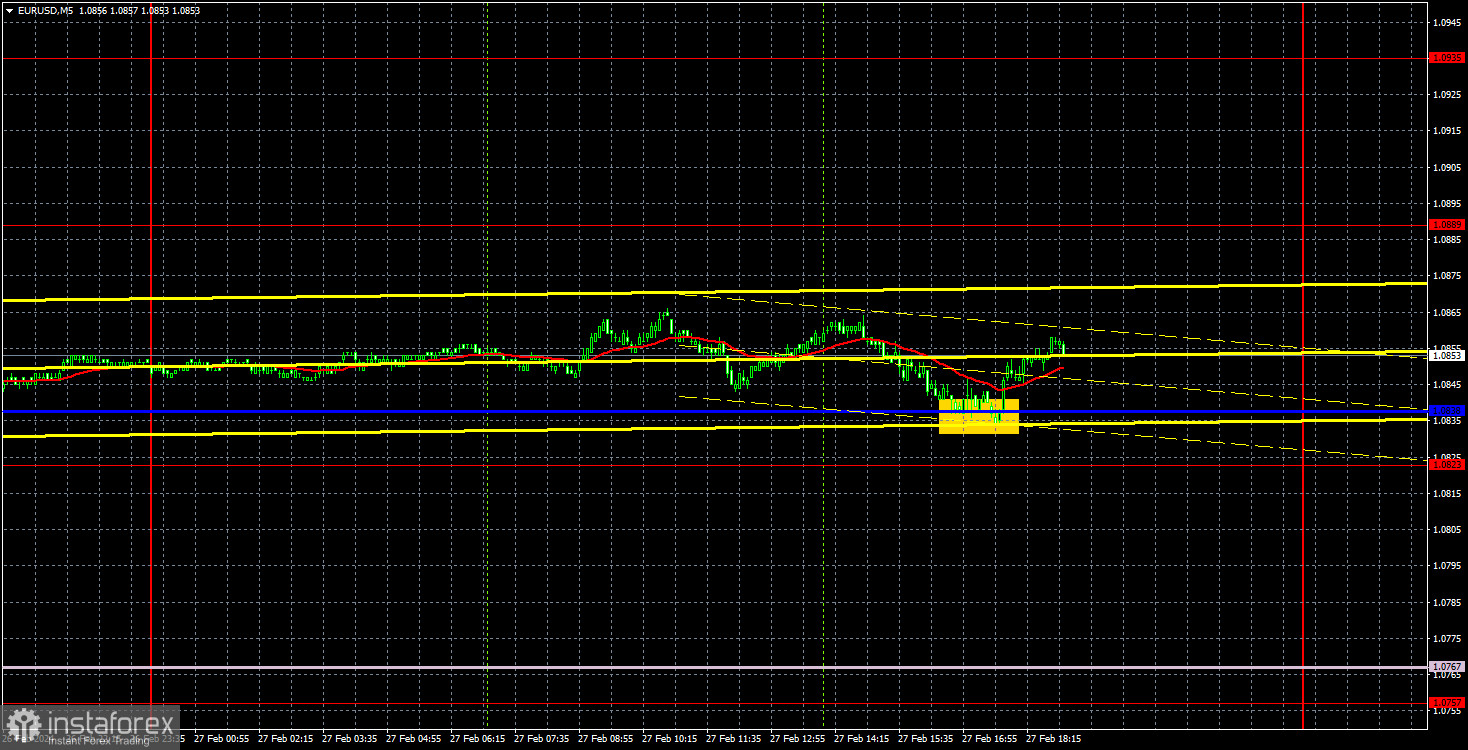
The EUR/USD currency pair, during the second trading day of the week, returned to its favored type of movement lately - a complete lack thereof. Despite the publication of a sufficiently important report on long-term durable goods orders in the US during the day, the value of which not only resonated and did not coincide with forecasts but also turned out to be significantly worse than even the most pessimistic expectations. Today, the US dollar could have shown a new downturn, corresponding to the current short-term trend. However, the market has confused itself about what to do with the EUR/USD pair. We saw a microscopic drop of 20 points, a bounce from the critical line, and an upward movement of about 20 points.
There were no significant fundamental events during the day. We mean important ones. Representatives of the ECB monetary committee continue to speak almost every day, but their rhetoric differs. Some believe it is necessary to move towards easing as soon as possible, while others do not. Therefore, it is impossible to conclude a unified ECB viewpoint. While the European currency has market support, the fundamental background of the global economy does not support it. Thus, we expect a strong decline in the euro currency.
Only one trading signal was formed during the day. During the US trading session, the pair bounced off the Kijun-sen line. Therefore, traders could open long positions. No other signals were formed by the end of the day, and the first one was not canceled. Therefore, the long position could be manually closed closer to the evening. The profit was about 10-15 points. Given yesterday's volatility, this result is quite good.
COT Report:
The latest COT report is dated February 20. The illustration above clearly shows that the non-commercial traders' net position has been bullish for a long time. In other words, the number of long positions in the market is higher than that of short positions. However, at the same time, the net position of non-commercial traders has been decreasing in recent months while commercial positions have been increasing. This indicates a shift in market sentiment to bearish as speculators increase the sale of the euro currency. We still do not see fundamental factors supporting the strengthening of the European currency, and technical analysis indicates the formation of a downward trend.
We have already pointed out to traders that the red and blue lines have diverged significantly, which often precedes the end of a trend. These lines are moving towards each other (indicating a trend change). Therefore, we continue to advocate for the decline of the European currency. During the last reporting week, the number of longs in the "non-commercial" group increased by 2.3 thousand, and the number of shorts decreased by 12.8 thousand. Accordingly, the net position increased by 10.5 thousand. The number of buy contracts is higher than that of sell contracts for non-commercial traders - by 68 thousand (52 thousand). Thus, professional traders continue to sell the euro currency.
EUR/USD 1H Analysis.
The pair maintains an upward trend on the hourly timeframe, but we view it skeptically. All factors continue to indicate the strengthening of the dollar. Thus, we expect the price to consolidate below the critical line and the resumption of the decline of the euro currency. The nearest target is the area of 1.0658-1.0669. The upward trend line has been overcome, so there needs to be more confidence in continuing the euro's growth.
On February 28, we highlight the following levels for trading - 1.0530, 1.0581, 1.0658-1.0669, 1.0757, 1.0823, 1.0889, 1.0935, 1.1006, 1.1092, as well as the Senkou Span B (1.0767) and Kijun-sen (1.0838) lines. Ichimoku indicator lines may move during the day, which should be considered when determining trading signals. Do not forget to set a Stop Loss order at breakeven if the price moves in the right direction by 15 points. This will protect against possible losses if the signal turns out to be false.
On Wednesday, there will again be very few important events. The second estimate of the GDP for the fourth quarter will be published in the United States, which is much less important than the first and third. Therefore, we do not expect any reaction to this report. Most likely, volatility will remain low, and intraday movements will be very weak.
Explanations for the illustrations:
Price support and resistance levels - thick red lines near which movement may end. They are not sources of trading signals.
Kijun-sen and Senkou Span B lines - Ichimoku indicator lines transferred from the 4-hour timeframe to the hourly timeframe. They are strong lines.
Extreme levels - thin red lines from which the price bounced earlier. They are sources of trading signals.
Yellow lines - trendlines, trend channels, and any other technical patterns.
Indicator 1 on COT charts - the size of the net position of each category of traders.


