Analysis of GBP/USD 5M.

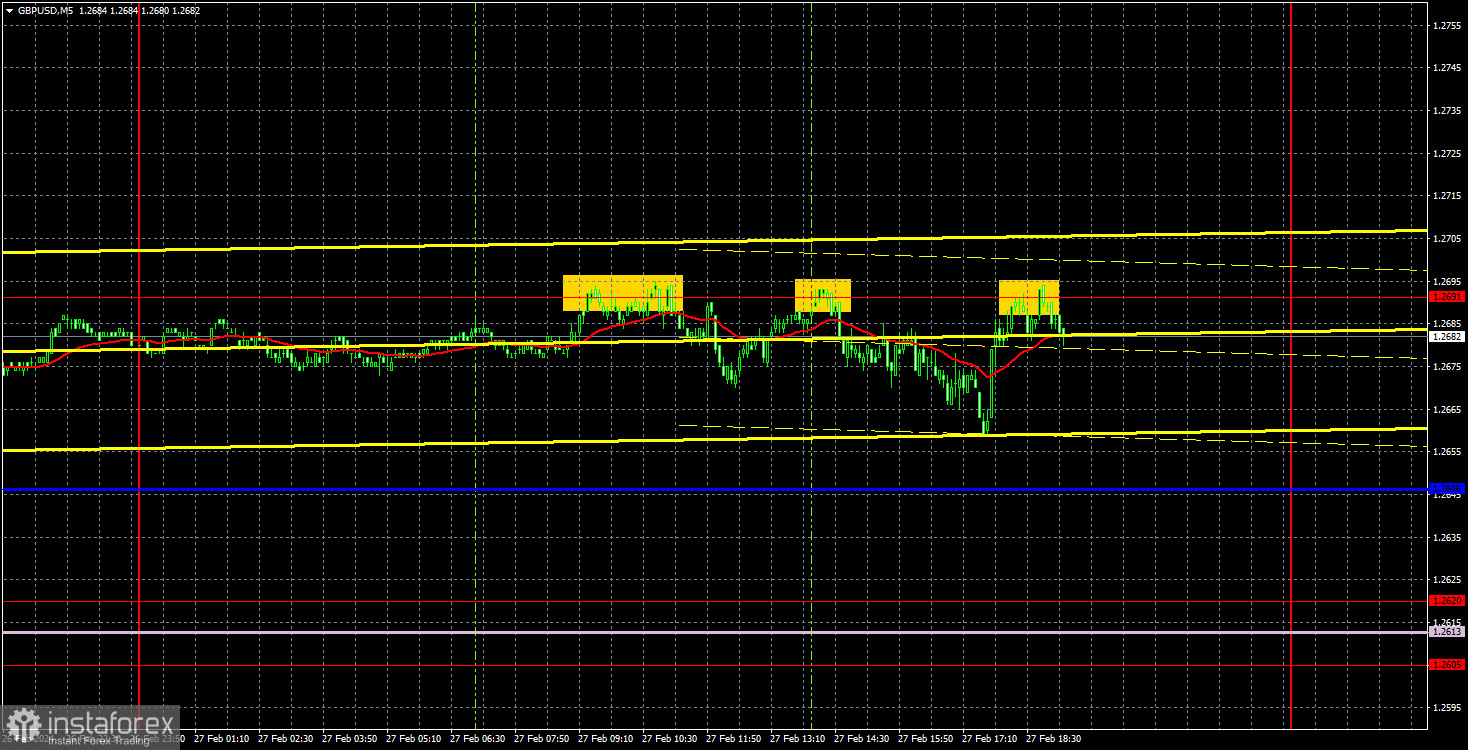
The currency pair GBP/USD, during the second trading day of the week, for the fourth and fifth consecutive time, tested the level of 1.2691 and once again failed to overcome it. Thus, a new downward movement phase may start from this level, which would be more logical and consistent than a new pound strengthening. Unfortunately, the British currency remains in a flat. It may not be as clear and pronounced as before, but it still exists and is visible on higher timeframes. Accordingly, we observe constant changes in the direction of movement and short-term weak trends from which it is very difficult to profit. And in the last few days, the pair has been trading between the marks of 1.2650 and 1,2700. In other words, in a flat within a flat and with minimal volatility.
In principle, there is nothing to add to the above. In the medium-term perspective, we expect the pound to do the same as before - decline, but the market is still in no hurry to sell, although most factors continue to point downwards. On Tuesday, there were no significant events or publications in the UK, but even an important American report failed to increase traders' desire to trade actively. The situation is extremely unfavorable.
On Tuesday, three trading signals were formed for the pound. The pair spent the entire day between the critical line and the level of 1.2691, from which it bounced three times. At best, a 20-point downward move was made. Each time, the pair returned to the initial positions, so profiting from one of the trading positions was impossible. All trades closed at breakeven with Stop Loss.
COT Report:
COT reports on the British pound show that commercial traders' mood has often changed in recent months. The red and blue lines, reflecting the net positions of commercial and non-commercial traders, constantly intersect and, in most cases, are close to the zero mark. According to the latest report on the British pound, the "Non-commercial" group closed 2.9 thousand buy contracts and opened 1.2 thousand sell contracts. Thus, the net position of non-commercial traders decreased by 4.1 thousand contracts in a week. Although the speculators' net position is increasing, the fundamental background still does not provide grounds for long-term purchases of the British pound.
The "Non-commercial" group currently has 87.6 thousand contracts for buying and 42.3 thousand for selling. The bulls have a double advantage. However, in recent months, we have repeatedly encountered similar situations: the net position increases or decreases, the advantage shifts from bulls to bears, and vice versa. Since COT reports do not predict market behavior well, we need to pay more attention to technical analysis and macroeconomic statistics. The technique allows for a new strong pound decline, and macroeconomic reporting has long been stronger in the United States than in the United Kingdom. However, the dollar has not yielded any dividends so far.
On the hourly timeframe, the pound/dollar pair has left the sideways channel 1.2611-1.2787 and can still transition to the formation of a downward trend. However, the market is still in no hurry to sell the British currency. The price moves sideways (visible on higher timeframes), market participants feel comfortable, and the market is flat. The British pound remains a currency that tends towards sideways movement and trades illogically and chaotically. On lower timeframes, we regularly observe short-term trends, but even on them, earning is extremely problematic, as the price constantly changes direction, and volatility is low.
On February 28, we highlight the following important levels: 1.2215, 1.2269, 1.2349, 1.2429-1.2445, 1.2516, 1.2605-1.2620, 1.2691, 1.2786, 1.2863, 1.2981-1.2987. Senkou Span B (1.2613) and Kijun-sen (1.2646) lines can also be sources of signals. A Stop Loss level is recommended to be set at breakeven when the price moves in the right direction by 20 points. Ichimoku indicator lines may move during the day, which should be considered when determining trading signals.
On Tuesday, planned events or publications are absent in the UK or the United States. The report on GDP for the fourth quarter in the second estimate will be released, the value of which is extremely low for the market. We do not expect a market reaction to this report. Therefore, we have to wait for the pair to consolidate above the level of 1.2691 or below the critical line to have the opportunity to count on any movement.
Explanations for the illustrations:
Price support and resistance levels - thick red lines near which movement may end. They are not sources of trading signals.
Kijun-sen and Senkou Span B lines - Ichimoku indicator lines transferred from the 4-hour timeframe to the hourly timeframe. They are strong lines.
Extreme levels - thin red lines from which the price bounced earlier. They are sources of trading signals.
Yellow lines - trendlines, trend channels, and any other technical patterns.
Indicator 1 on COT charts - the size of the net position of each category of traders.


