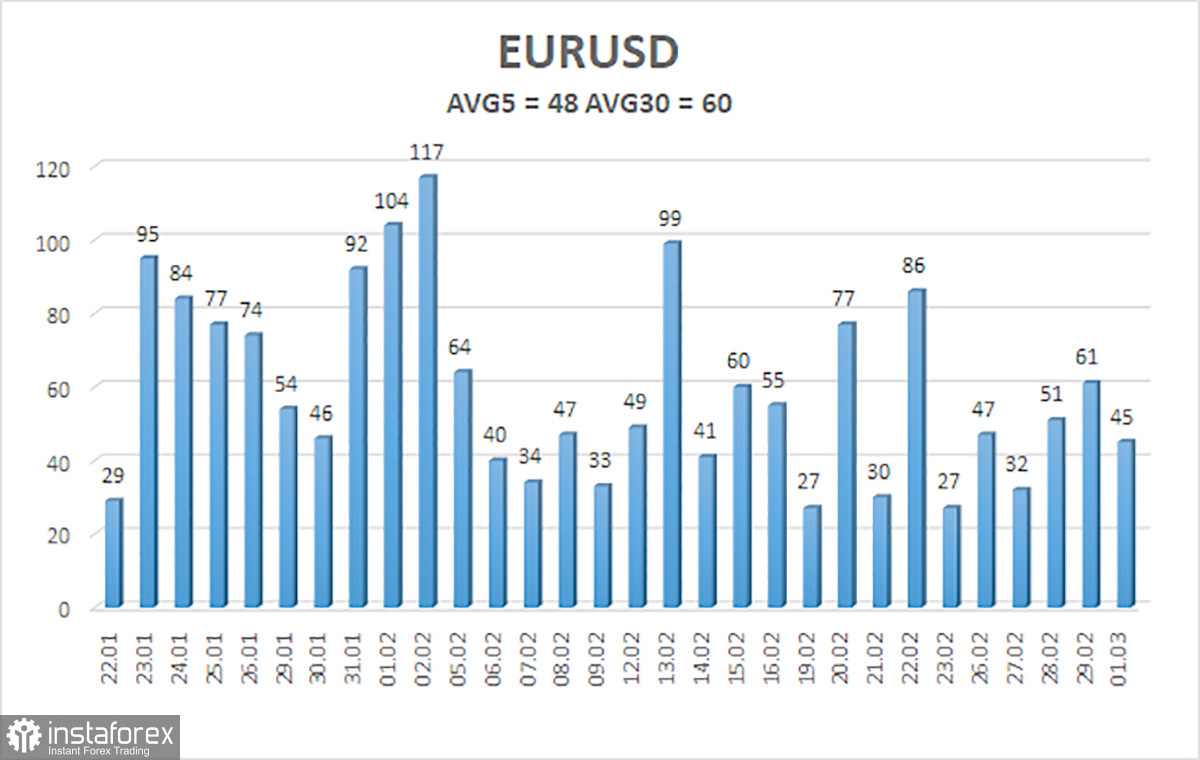
The EUR/USD currency pair continued to trade with low volatility on Friday, which, however, no longer surprises anyone. The illustration below clearly shows how much the indicator has declined in the last few weeks. The average volatility for the last 5 days is only 48 points. We have repeatedly mentioned that with such volatility, trading is only feasible in the medium or long term, where the position is open for weeks or even months. It is reasonable to assume that in this case, the analysis should be carried out over longer timeframes.
In the 24-hour timeframe, our situation remains unchanged. And nothing is surprising about it because what changes can there be when movements are very weak or absent? In recent weeks, the pair has risen to the critical line, but the Ichimoku indicator signals a new phase of the downtrend. Therefore, we still expect the European currency to fall, at least to the level of 1.0450. It may take one or two months for this to happen, but our expectations remain unchanged.
Macroeconomic and fundamental factors currently have a somewhat indirect impact on the pair's movement. Macroeconomics causes a local market reaction, which is not always in favor of the dollar, but the overall economic situation remains in favor of the US economy, which is stronger and more stable than the European one. As for the fundamental background, the market continues to soften expectations for a reduction in the Fed's rate and tighten expectations for the ECB's rate.
Recall that at the beginning of the year, the Fed was expected to have at least 6 rate cuts only in 2024. Now we are talking about a total of 5 steps to ease monetary policy. The same goes for timing. If at the beginning of the year, the market believed that the first easing would happen in March, now almost no one expects rate cuts before June. These changes can be considered "changes in a hawkish direction," so we believe that the fundamental background continues to support the dollar.
Next week, there will be an ECB meeting and several less important reports will be published in the European Union. We do not think it is necessary to separately consider publications like retail sales or business activity indices. Everything is clear with them. If the data turns out to be better than expected, one can expect the euro to strengthen. And vice versa. Globally, this data will not affect market sentiment.
Another matter is the ECB meeting and Christine Lagarde's speech. The head of the European regulator may soften her attitude towards monetary policy after the February inflation report, according to which the growth rate of consumer prices decreased to 2.6% y/y. In any case, from Mrs. Lagarde, one can now expect either a softening of rhetoric or neutral rhetoric. Therefore, in the best case, the euro will not be under additional pressure. In the worst case, it may continue to decline, which is what we are expecting.
Also, in the United States, a fairly large number of important macroeconomic statistics will be published. The beginning of the month is the time for publishing data on the labor market and unemployment. In general, in almost any case, we continue to expect the EUR/USD pair to fall.

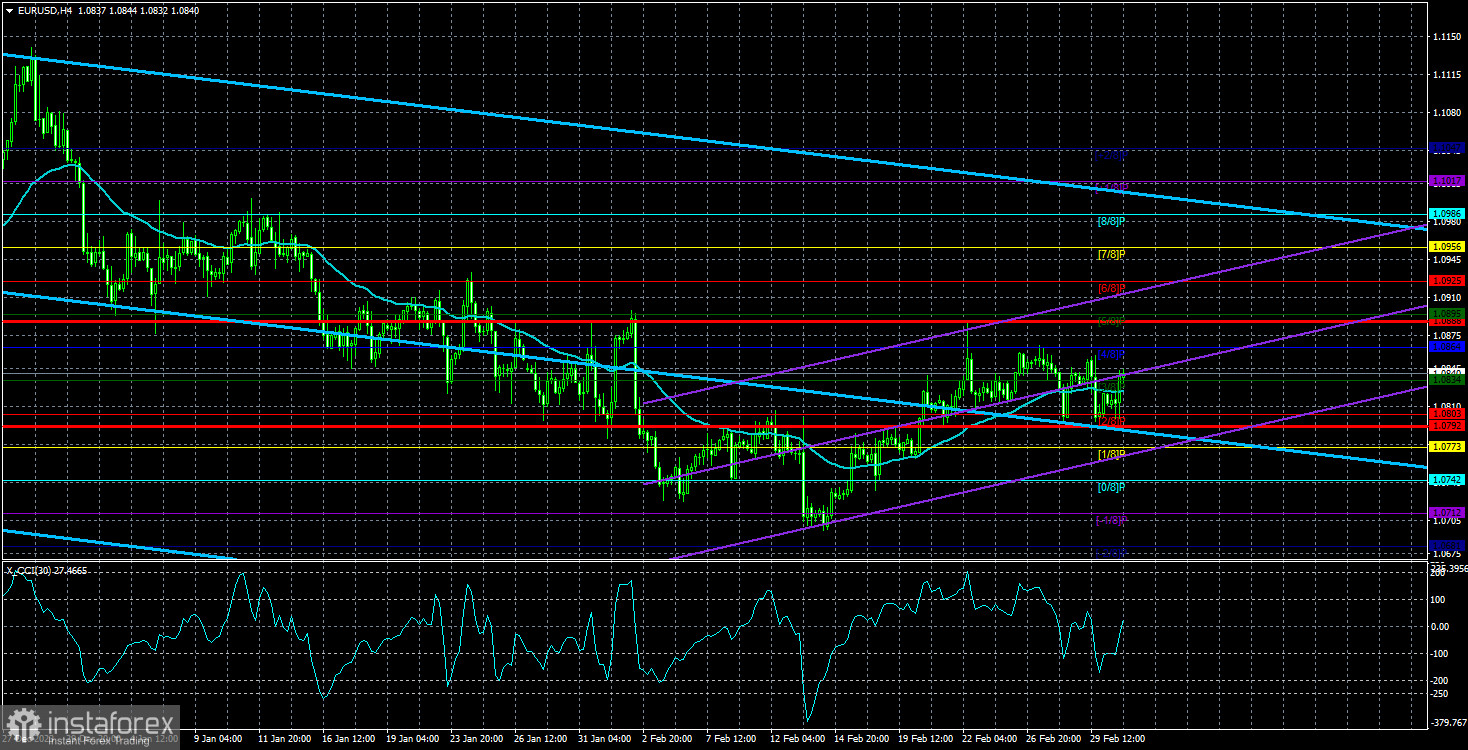
The average volatility of the euro/dollar currency pair for the last 5 trading days as of March 4 is 48 points and is characterized as low. Thus, we expect the pair to move between the levels of 1.0792 and 1.0888 on Monday. The senior linear regression channel is still pointing down, so the downtrend persists. The oversold CCI indicator triggered a small upward correction, which may already be completed.
Nearest support levels:
S1 – 1.0834;
S2 – 1.0803;
S3 – 1.0773.
Nearest resistance levels:
R1 – 1.0864;
R2 – 1.0895;
R3 – 1.0925.
Trading Recommendations:
The EUR/USD pair has again changed its position relative to the moving average, but we continue to look towards short positions with a target of 1.0681, at least. The decline of the European currency is stable but slow, with very frequent corrections. It also has very low volatility. We see no reason for a global rise in the euro. Long positions are unlikely to be considered soon, as any pair growth is corrective. Even if the price consolidates above the moving average.
Explanations for the illustrations:
Linear regression channels help determine the current trend. If both are pointing in the same direction, the trend is strong at the moment.
The moving average line (settings 20.0, smoothed) determines the short-term trend and direction to trade in at the moment.
Murray levels - target levels for movements and corrections.
Volatility levels (red lines) - the likely price channel in which the pair will spend the next day, based on current volatility indicators.
CCI indicator - its entry into the oversold area (below -250) or the overbought area (above +250) means that a trend reversal in the opposite direction is approaching.


