


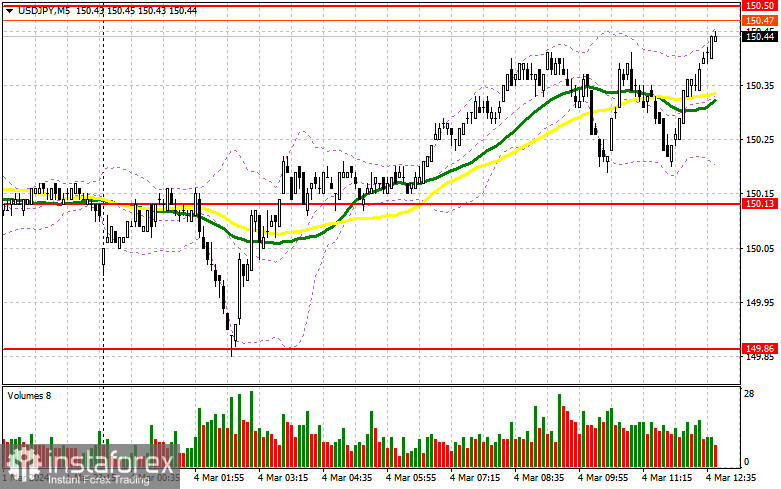
Earlier, I paid attention to the level of 150.13 and planned to make decisions on entering the market from it. Let's look at the 5-minute chart and figure out what happened there. The pair declined, but we did not see a test or the formation of a false breakdown. For this reason, it was not possible to obtain suitable entry points into the market. The technical picture remained the same for the second part of the day.
Conditions for opening long positions on USD/JPY:
Now, it is very important how traders react to the statements of FOMC member Patrick T. Harker and his soft stance on monetary policy. If we talk about keeping rates unchanged, at least until the summer of this year, then a new wave of USD/JPY growth will hardly be avoided. In case of a decrease in the pair, I will act in the area of the nearest support of 150.13, formed today. Only the formation of a false breakdown will create suitable conditions for increasing the volume of long positions in the expectation of a new breakthrough to 150.50. A breakout and a downward test of this range will lead to another good option to buy the dollar, which may push USD/JPY up to the area of 150.83, a yearly high. The farthest target will be the area of 151.21, where I am going to lock in profits. In the scenario of a decline in the pair and lack of activity at 150.13, and there are plenty of reasons for this, pressure on the dollar will return. This will lead to a slight decline to the area of 149.86. Only a false breakdown will give a signal to open long positions. I plan to buy USD/JPY immediately after a rebound from the low of 149.55 in order to gain 30-35 pips within the day.
Conditions for opening short positions on USD/JPY:
In case of further growth in the pair, bears will certainly become active in the area of 150.50. The formation of a false breakdown will be a suitable condition for opening short positions with the expectation of a decrease to the intermediate support of 150.13. A breakout and an upward test of this range will deal a more serious blow to the bulls' positions, which will affect stop orders and open the way to 149.86, which will definitely affect the upward potential of the pair, increasing the chances of a decline in the dollar. The farthest target will be the area of 149.55, where I am going to lock in profits. If USD/JPY grows and bears fail to be active at 150.50, buyers will regain control over the market. However, it would be premature to talk about the development of a more powerful uptrend. In this case, it is best to postpone selling until the test of the next resistance of 150.83. In the absence of a downward movement, I will sell USD/JPY immediately after a rebound from 151.21, but only counting on a correction of the pair by 30-35 pips within the day.
COT report
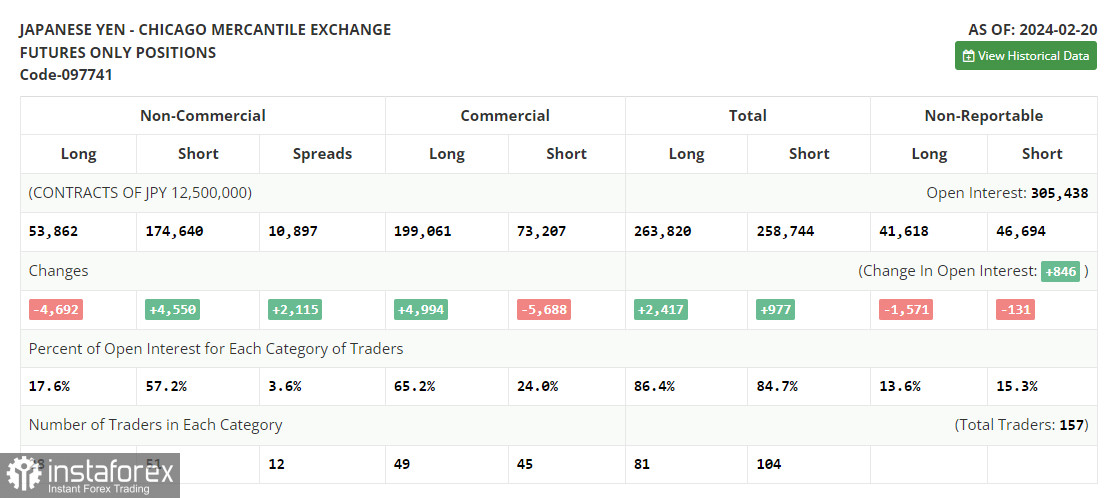
On February 20, the COT report (Commitment of Traders) showed an increase in short positions and a decrease in long ones. Given that the market situation is uncertain, the US dollar/Japanese pair is trading sideways, as proven by the futures market dynamics. According to the latest COT report, non-commercial long positions decreased by 4,692 to 53,862, while non-commercial short positions jumped by 4,550 to 174,640. As a result, the spread between long and short positions increased by 2,115.
Indicators' signals
Moving averages
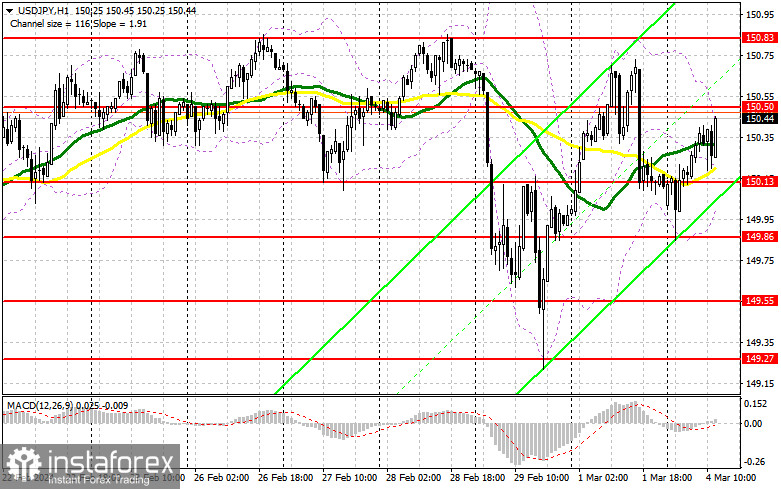
The instrument is trading above the 30 and 50-day moving averages, which points to a rise in the US dollar.
Note: The period and prices of the moving averages are considered by the analyst on the 1-hour chart and differ from the general definition of classic daily moving averages on the daily chart.
Bollinger Bands
In case GBP/USD goes down, the indicator's lower border at about 1.2625 will act as support.
Description of indicators
- Moving average (moving average, determines the current trend by smoothing out volatility and noise). Period 50. It is marked yellow on the chart.
- Moving average (moving average, determines the current trend by smoothing out volatility and noise). Period 30. It is marked green on the chart.
- MACD indicator (Moving Average Convergence/Divergence—convergence/divergence of moving averages) Quick EMA period 12. Slow EMA period to 26. SMA period 9
- Bollinger Bands (Bollinger Bands). Period 20
- Non-commercial speculative traders, such as individual traders, hedge funds, and large institutions that use the futures market for speculative purposes and meet certain requirements.
- Long non-commercial positions represent the total long open position of non-commercial traders.
- Short non-commercial positions represent the total short open position of non-commercial traders.
- Total non-commercial net position is the difference between short and long positions of non-commercial traders.


