EUR/USD

Higher Timeframes
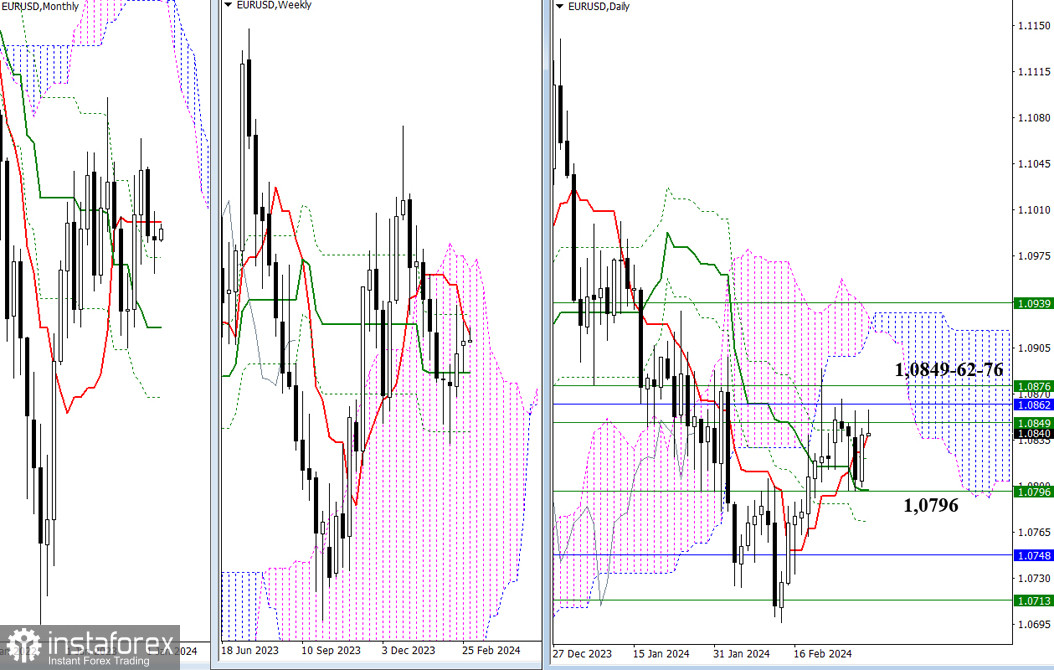
Towards the end of last week, bulls formed a daily golden cross and signaled their intent to capitalize on this opportunity. The immediate cluster of resistances today covers the path of bullish sentiments at the levels of 1.0849 – 1.0862 – 1.0876 (weekly levels + monthly short-term trend). A solid consolidation above will open up new prospects for an upward movement. The current support for bullish sentiments at the moment is provided by the daily cross (1.0840 – 1.0821 – 1.0797 – 1.0773), reinforced by the weekly medium-term trend (1.0796).

H4 – H1
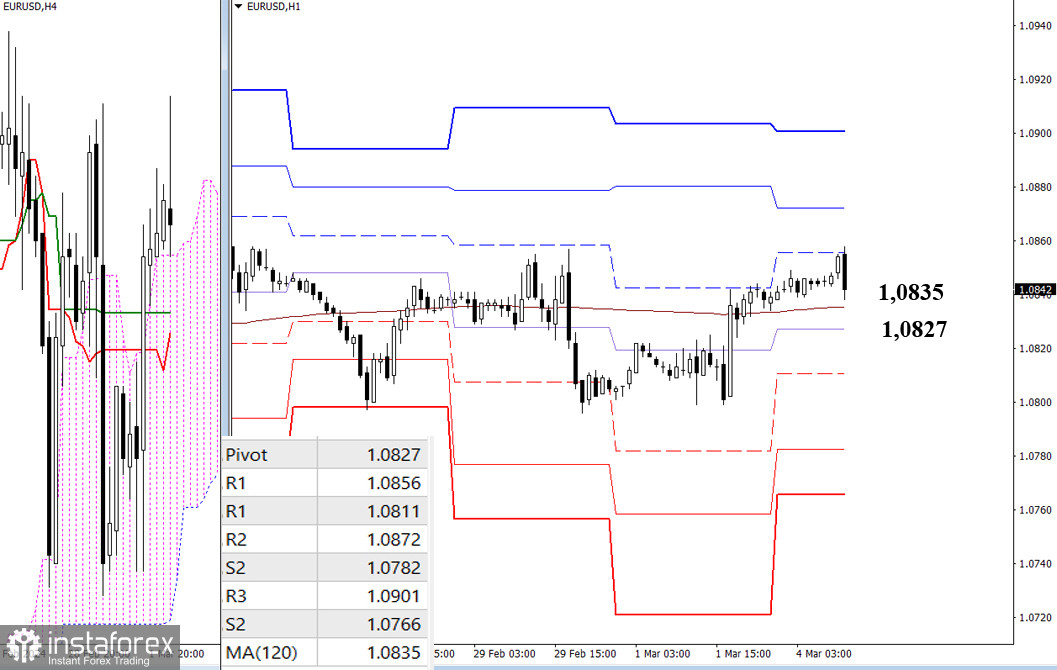
On lower timeframes, the pair is currently trading above crucial levels, providing an advantage to the bulls. The potential for upward movement during the day can be realized by overcoming the resistances of classic pivot points (1.0856 – 1.0872 – 1.0901). Presently, the initial resistance at 1.0856 is undergoing a test of its strength. A breakthrough of significant levels, presently converging around 1.0827 – 1.0835 (central pivot point of the day + weekly long-term trend), could potentially shift the current balance of power. Key reference points for a downward movement within the day include the supports of classic pivot points (1.0811 – 1.0782 – 1.0766).
***
GBP/USD

Higher Timeframes
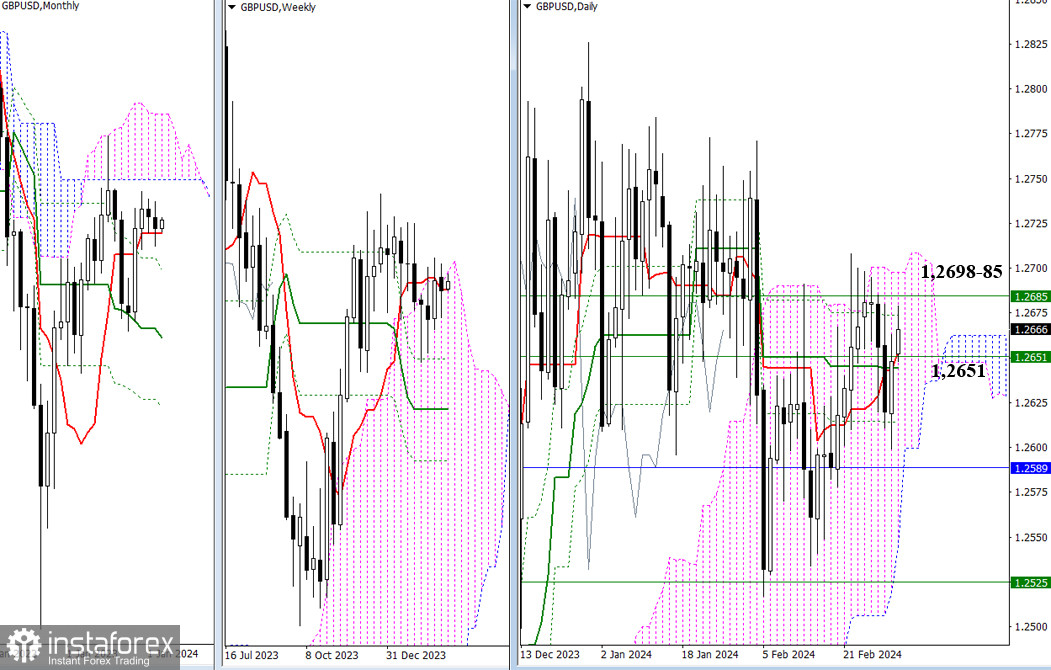
Despite the uncertainty expressed at the close of last week, bulls formed a daily golden cross. Now, if they focus on restoring their positions, they need to, as previously assumed, enter the bullish zone relative to the daily (1.2698) and weekly (1.2685) Ichimoku clouds. After that, new prospects can be considered. The opponent can change the situation by reclaiming the nearest supports; today, it is the daily cross (1.2644 – 1.2653), reinforced by the weekly short-term trend (1.2651), and the support of the monthly short-term trend (1.2589).

H4 – H1
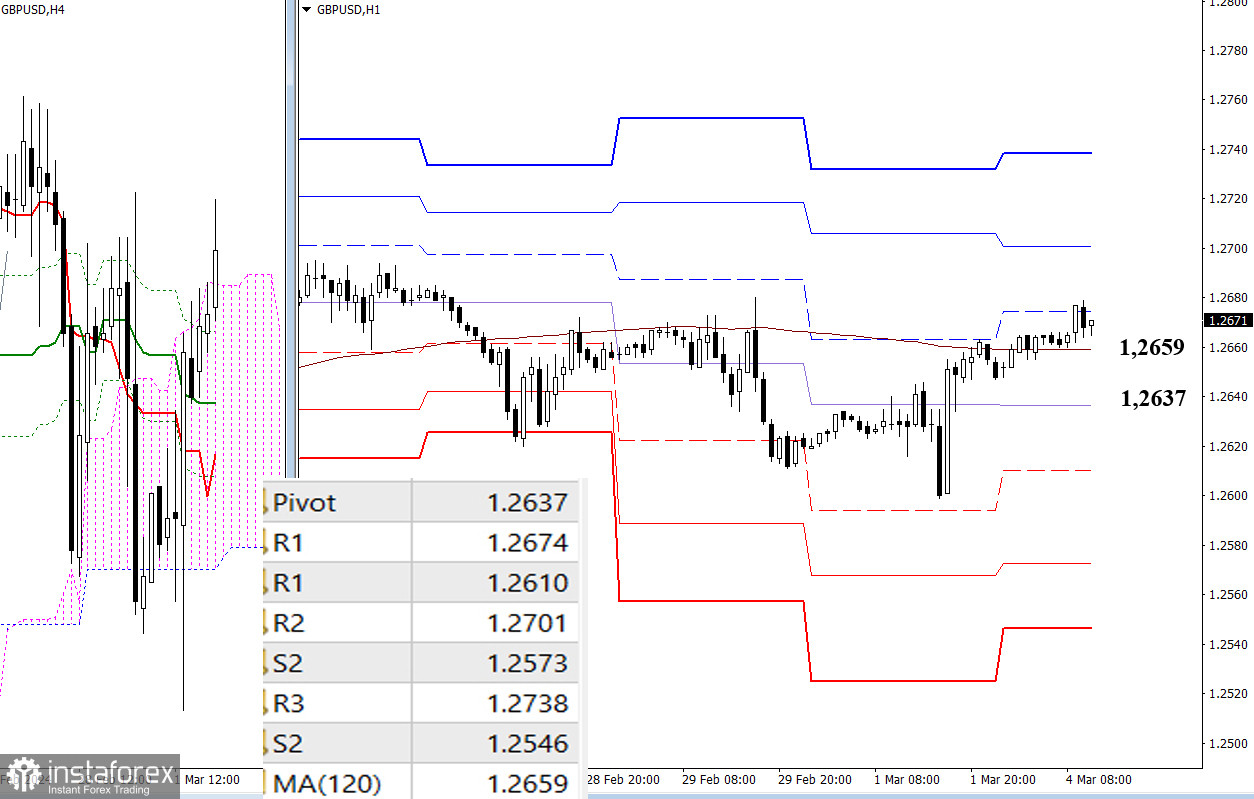
Bullish players have strengthened their positions above key levels, identified today within the range of 1.2659–37 (central pivot point of the day and the weekly long-term trend). Consolidation above provides an advantage to the bulls. As of writing, the initial resistance from classic pivot points (1.2674) is being tested, and the continuation of bullish sentiments could unfold by overcoming subsequent resistances R2 (1.2701) and R3 (1.2738). If the key levels (1.2659–37) are breached, it will alter the existing balance of power.
Subsequently, bearish activity may resurface, with intraday targets being the support levels of classic pivot points (1.2610 – 1.2573 – 1.2546).
***
The technical analysis of the situation uses:
Higher timeframes - Ichimoku Kinko Hyo (9.26.52) + Fibonacci Kijun levels
Lower timeframes - H1 - Pivot Points (classic) + Moving Average 120 (weekly long-term trend)


