


Trend analysis (Fig. 1).
The GBP/USD currency pair may move downward from the level of 1.2728 (closing of yesterday's daily candle) to 1.2725, the 14.6% pullback level (yellow dotted line). Upon reaching this level, an upward movement is possible to the upper fractal at 1.2771 (blue dotted line).
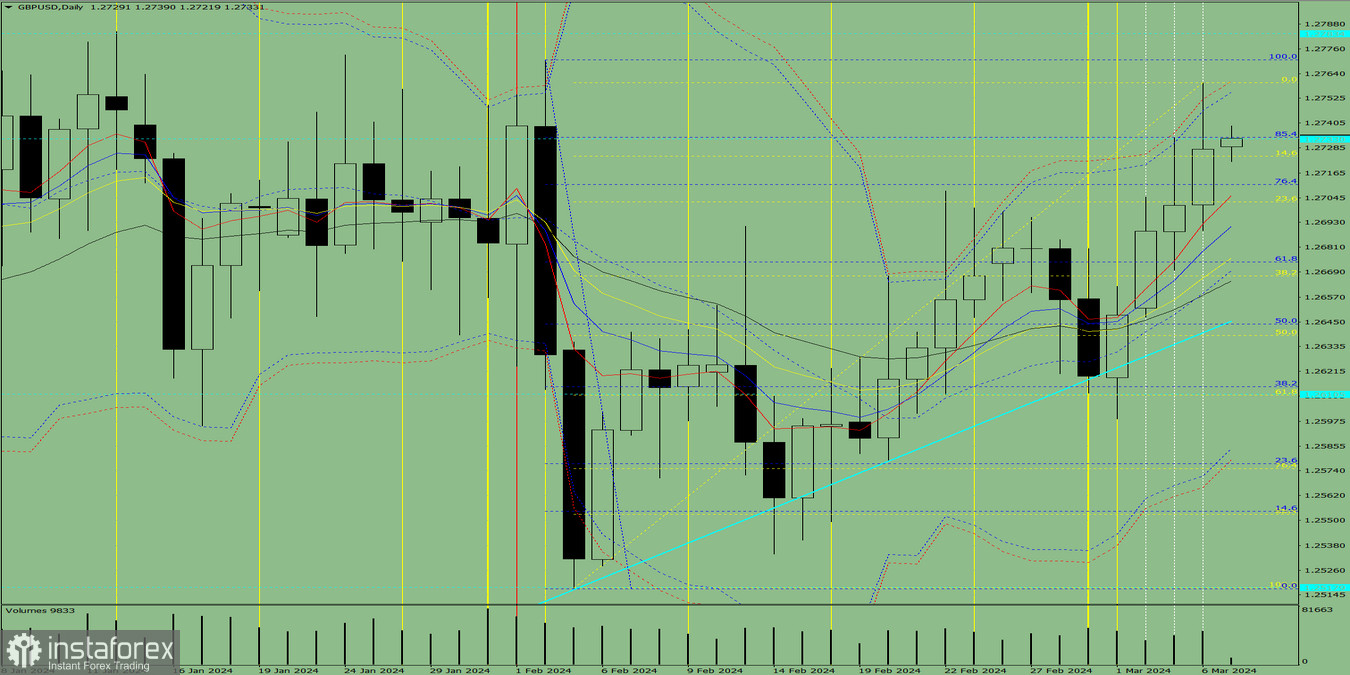
Fig. 1 (daily chart).
Comprehensive analysis:
- Indicator analysis – up;
- Fibonacci levels – up;
- Volumes – up;
- Candlestick analysis – up;
- Trend analysis – up;
- Bollinger bands – up;
- Weekly chart – up.
General conclusion: Today, the price may move downward from the level of 1.2728 (closing of yesterday's daily candle) to 1.2725, the 14.6% pullback level (yellow dotted line). Upon reaching this level, an upward movement is possible to the upper fractal at 1.2771 (blue dotted line).
Alternatively, from the level of 1.2728 (closing of yesterday's daily candle), the price may move downward to 1.2703, the 23.6% pullback level (yellow dotted line). Upon reaching this level, an upward movement is possible to the upper fractal at 1.2771 (blue dotted line).


