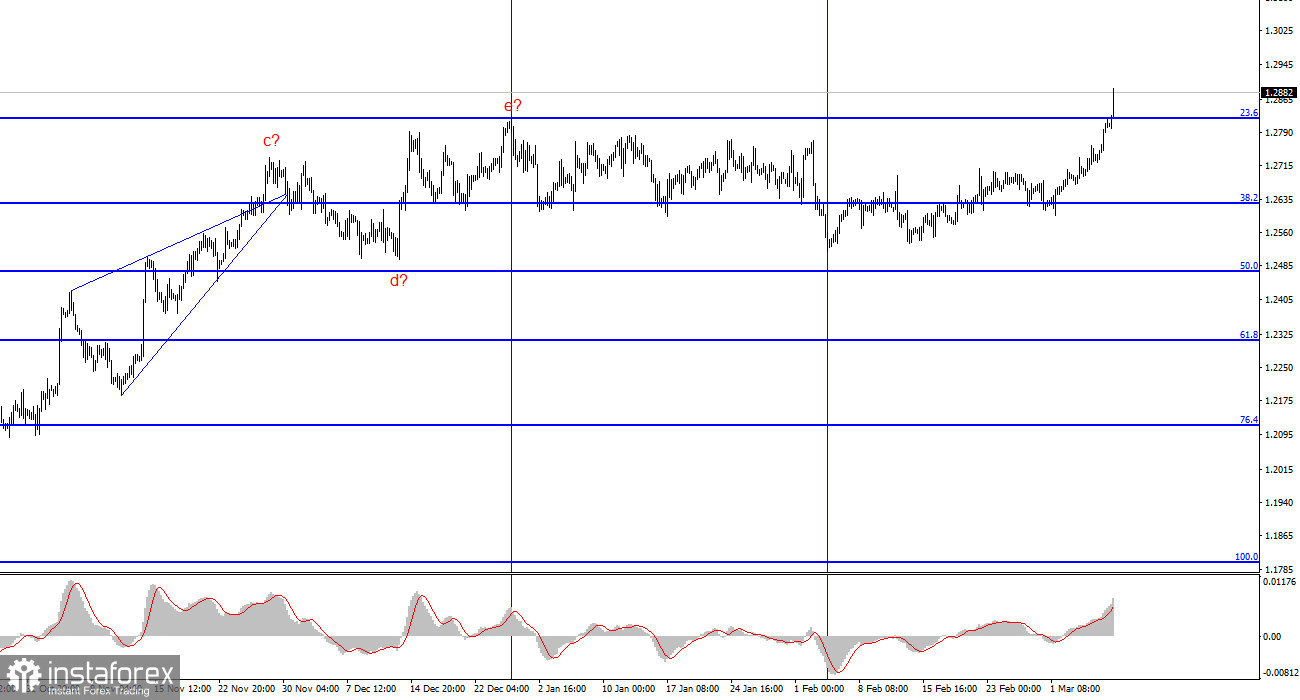
For the GBP/USD pair, the wave analysis remains quite clear and, at the same time, remains complex. The construction of a new downward trend section continues, the first wave of which has received a very extended appearance. The second wave also turned out to be quite long, which gives us every reason to expect a long-term construction of the third wave.
At the moment, I have no confidence that the construction of wave 2 or b is complete. Wave 2 or b has already taken a five-wave form, but at the same time, it has become more complicated again due to the increase in the quotes of the British pound this week. Now we need to look for waves inside the current upward wave of the higher scale in order to try to predict its completion. Theoretically, wave 2 or b can take a length of up to 100% of wave 1 or a. The pair has been trading horizontally for three months, and now it has almost suddenly resumed growth, which confuses me.
The targets for lowering the pair within the expected wave 3 or c are located below the 1.2039 mark, which corresponds to the low of wave 1 or a. Unfortunately, the wave analysis tends to become more complicated and does not correspond to the news background. I'm not giving up on the working scenario at the moment, but the market doesn't find anything better than shopping.
The GBP/USD exchange rate increased by 80 basis points on Thursday and by another 70 today. Yesterday, the news background absolutely did not suggest such an increase in the British pound, but today everything was natural. Unfortunately, the demand for the pound is growing with and without reason. If the market does nothing but buy, then no wave analysis can withstand such an onslaught. Now that it has become clear that wave 2 or b will become even more complicated in the time period between December 28 and February 5, it is necessary to identify a corrective set of waves in its composition. The fact that the internal marking of this wave has already taken on an absolutely unreadable form is an obvious fact. The fact that the news background is not so strong for the British pound means that the demand for it has been growing for 5 months – too.
Today, not only did nonfarm payrolls turn out to be weaker than market expectations in terms of the aggregate values for January and February, but the unemployment report was pretty disappointing. The unemployment rate rose to 3.9% in February, although the market did not expect any increase. Against the background of these two reports, wage data no longer had any weight for market participants. Specifically, today the increase in the GBP/USD pair was natural, but recently not every day can be said to be the same.
General conclusions.
The wave analysis of the GBP/USD pair still suggests a decline. At the moment, I am considering selling the pair with targets located below the 1.2039 mark, as I believe that wave 3 or c will begin sooner or later. However, until wave 2 or b is completed, we can expect the pair to rise up to 1.3140, which corresponds to 100.0% Fibonacci. A successful attempt to break through the 1.2877 mark, which equates to 76.4% Fibonacci, will indicate the market's readiness to further increase demand. In this case, you can continue to consider buying the pair.
At the higher wave scale, the picture is similar to the EUR/USD pair, but there are still some differences. The downward correction section of the trend continues to build, and its second wave has acquired an extended appearance – by 61.8% of the first wave. An unsuccessful attempt to break through this mark may lead to the beginning of building 3 or C.
The basic principles of my analysis:
1) Wave structures should be simple and understandable. Complex structures are difficult to play out; they often bring changes.
2) If you are not sure what is happening in the market, it is better not to enter it.
3) There is no absolute certainty in the direction of movement, and there can never be. Do not forget about stop-loss protection orders.
4) Wave analysis can be combined with other types of analysis and trading strategies.


