


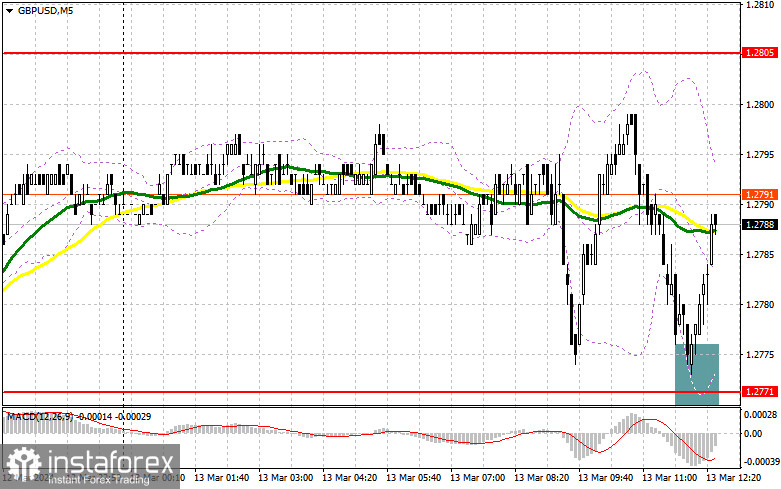
In my morning forecast, I focused on the level of 1.2771 and planned to make decisions on market entry based on it. Let's take a look at the 5-minute chart and analyze what happened. The decline and the formation of a false breakout there allowed for a buy signal for the pound, resulting in a slight upward movement of 15 points. Considering that we did not break out of the sideways channel, the technical picture remained unchanged for the second half of the day.
To open long positions on GBP/USD:
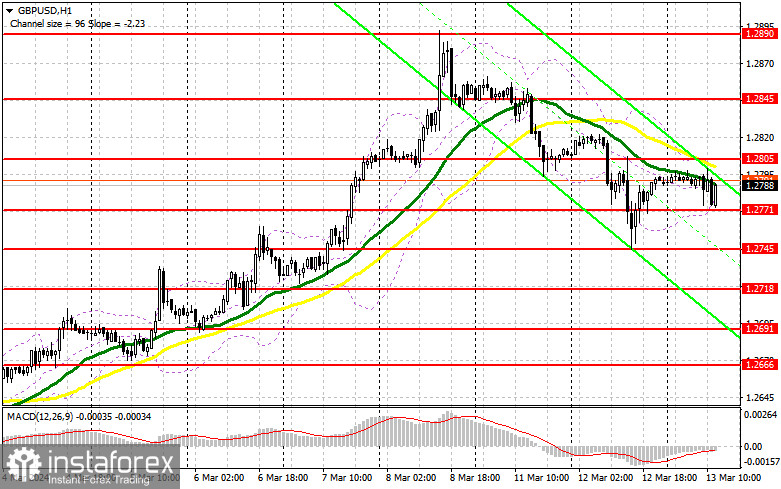
GDP data and several other statistics for the UK led to a slight decline in the pound, but it did not significantly affect the technical picture. In the second half of the day, there are no US statistics, so we continue trading within the sideways channel. In the case of a pair decline, only the formation of a false breakout near the nearest support at 1.2771, similar to what I discussed earlier, will provide a suitable entry point for long positions, counting on a return to the bullish trend with the prospect of an update to 1.2805 – a new resistance where buyers are likely to face serious challenges. Breaking and consolidating above this range will strengthen demand for the pound and open the way to 1.2845, further reinforcing bullish positions. The ultimate target will be the maximum of 1.2890, where I plan to take profits. In the scenario of a pair decline and the lack of bullish activity at 1.2771, things will go badly for the bulls. In such a case, only a false breakout near the next support at 1.2745 will confirm the correct entry point. I plan to buy GBP/USD immediately on the rebound from the minimum of 1.2718, with a target of a correction within the day of 30-35 points.
To open short positions on GBP/USD:
The bears tried, but it didn't go well. Only a false breakout around the resistance at 1.2805 will confirm the sell signal, leading to a small correction and a downward movement to around 1.2771 – the support that has already been tested several times today in the first half of the day. Therefore, breaking and retesting this range from bottom to top will deal another blow to bullish positions, leading to stop-loss orders being triggered and opening the way to 1.2745. There, I expect the emergence of major buyers. The ultimate target will be the area around 1.2718, where profits will be taken. In the case of GBP/USD growth and the absence of activity at 1.2805 in the second half of the day, buyers will again feel the strength for further development of the upward trend. In such a case, I will postpone selling until there is a false breakout at the level of 1.2845. If there is no downward movement there, I will sell GBP/USD immediately on the rebound from 1.2890, but only counting on a pair correction down by 30-35 points within the day.

Indicator signals:
Moving Averages:
Trading is conducted below the 30 and 50-day moving averages, indicating further decline in the pair.
Note: On the hourly chart H1, the author determines the period and prices of moving averages, which are different from the standard definition of traditional daily moving averages on the daily chart D1.
Bollinger Bands:
In case of a decline, the lower boundary of the indicator at around 1.2771 will act as support.
Indicator Descriptions:
- Moving Average (smooths out volatility and noise, determines the current trend). Period 50. Marked in yellow on the chart.
- Moving Average (smooths out volatility and noise, determines the current trend). Period 30. Marked in green on the chart.
- MACD (Moving Average Convergence/Divergence) indicator. Fast EMA period 12. Slow EMA period 26. SMA period 9.
- Bollinger Bands indicator. Period 20.
- Non-commercial traders - speculators, such as individual traders, hedge funds, and large institutions using the futures market for speculative purposes and meeting certain requirements.
- Long non-commercial positions represent the total long open positions of non-commercial traders.
- Short non-commercial positions represent the total short open position of non-commercial traders.
- The total non-commercial net position is the difference between short and long positions of non-commercial traders.


