


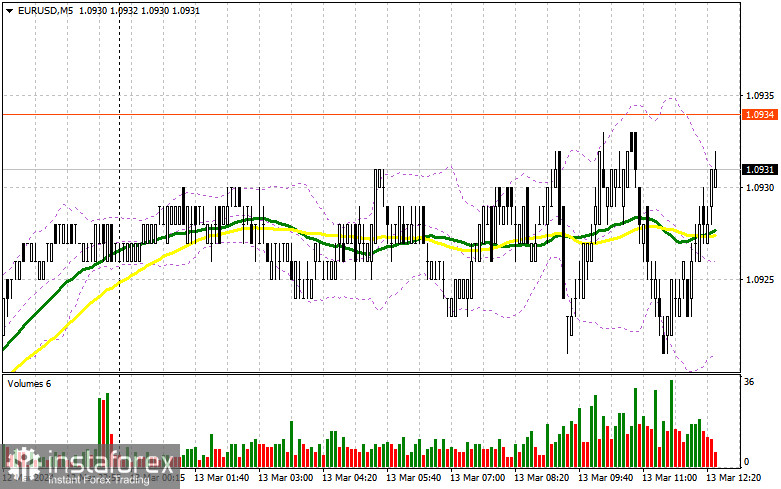
In my morning forecast, I pointed out the level of 1.0904 and planned to make decisions on market entry based on it. Let's take a look at the 5-minute chart and analyze what happened. A decline occurred, but due to low volatility, which amounted to about 12 points for a moment, and the lack of market participants willing to take active actions, there was no false breakout at this level. In the second half of the day, the technical picture remained unchanged, and all levels are still relevant.
To open long positions on EUR/USD:
Considering that there are no US statistics ahead, there can be no talk of a normal market. I will continue to bet on the strengthening of the euro in continuation of the bullish trend and look for entry points as low as possible. I prefer to act after the formation of a false breakout near the nearest support at 1.0904. This will be a suitable option for buying, counting on the continuation of the pair's growth to the area of 1.0941. Breaking and updating this range from top to bottom will strengthen the bullish trend with a chance to buy and a surge to 1.0966. The ultimate target will be the maximum of 1.0998, where I will take profits. In the case of a decline in EUR/USD and the absence of activity around 1.0904 in the second half of the day, pressure on the euro will increase, leading to a more significant decline with the prospect of updating to 1.0871. I plan to enter the market there only after the formation of a false breakout. I will consider opening long positions immediately on the rebound from 1.0843 with a target of an upward correction within the day of 30-35 points.
To open short positions on EUR/USD:
Bears also remain on the sidelines. Only an unsuccessful consolidation above 1.0941 will be a suitable condition for sales, with the prospect of another update to 1.0904 – the support formed by the end of yesterday. Breaking and consolidating below this range, as well as a reverse test from bottom to top, will give another selling point with the collapse of the pair to around 1.08719, where buyers will begin to act more actively. The ultimate target will be the minimum of 1.0843, where I will take profits. In the case of further upward movement of EUR/USD in the second half of the day in continuation of the bullish trend and the absence of bears at 1.0941, buyers will retain the advantage. In this case, I will postpone sales until the test of the next resistance at 1.0966. I will also sell there, but only after an unsuccessful consolidation. I plan to open short positions immediately on the rebound from 1.0998, with a target of a downward correction of 30-35 points.
Indicator signals:
Moving Averages:
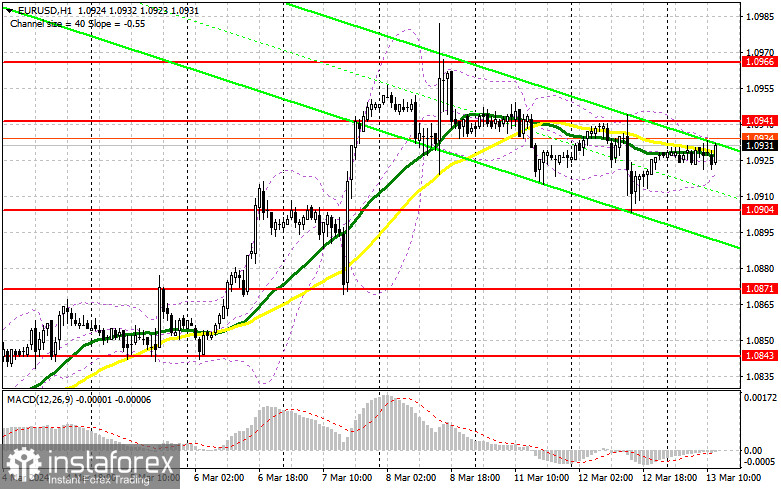
Trading is conducted around the 30 and 50-day moving averages, indicating a sideways market.
Note: On the hourly chart H1, the author determines the period and prices of moving averages, which are different from the standard definition of traditional daily moving averages on the daily chart D1.
Bollinger Bands:
In case of a decline, the lower boundary of the indicator at around 1.0915 will act as support.
Indicator Descriptions:
- Moving Average (smooths out volatility and noise, determines the current trend). Period 50. Marked in yellow on the chart.
- Moving Average (smooths out volatility and noise, determines the current trend). Period 30. Marked in green on the chart.
- MACD (Moving Average Convergence/Divergence) indicator. Fast EMA period 12. Slow EMA period 26. SMA period 9.
- Bollinger Bands indicator. Period 20.
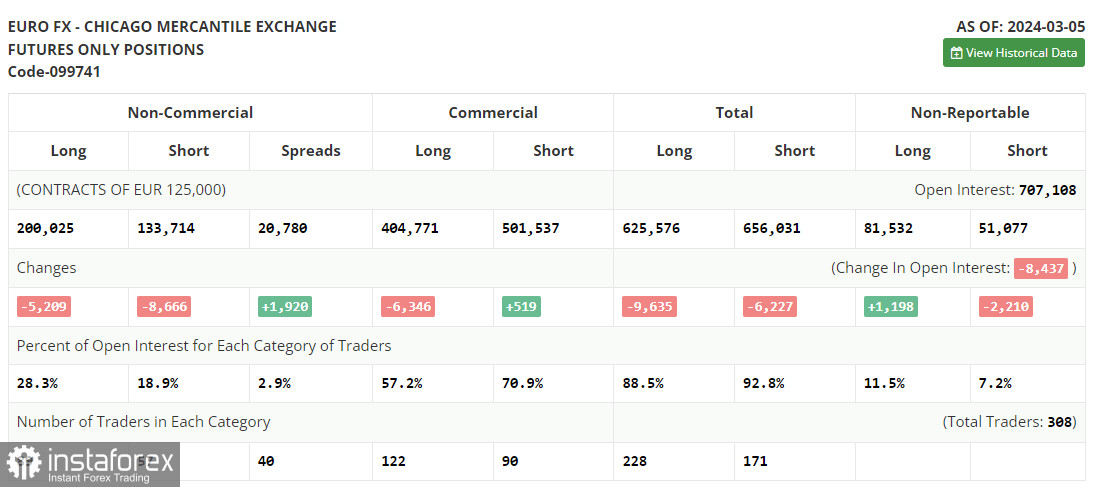
- Non-commercial traders - speculators, such as individual traders, hedge funds, and large institutions using the futures market for speculative purposes and meeting certain requirements.
- Long non-commercial positions represent the total long open positions of non-commercial traders.
- Short non-commercial positions represent the total short open position of non-commercial traders.
- The total non-commercial net position is the difference between short and long positions of non-commercial traders.


