


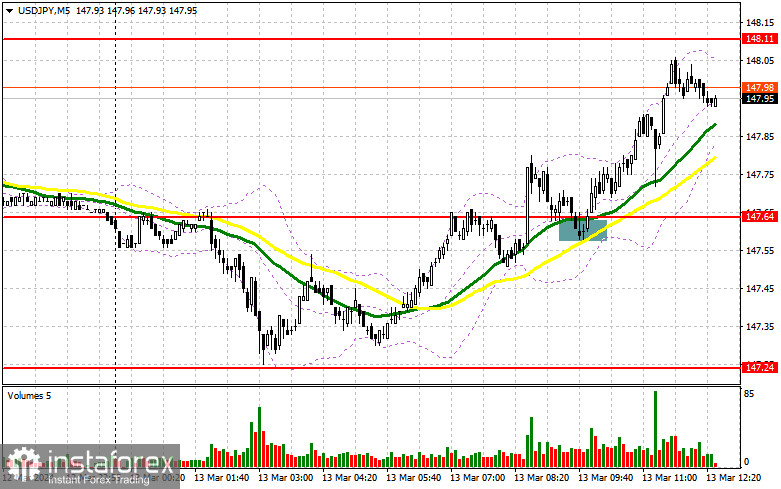
In my morning forecast, I paid attention to the level of 147.64 and planned to make decisions on entering the market from there. Let's look at the 5-minute chart and figure out what happened there. The breakout and reverse test from top to bottom of this range gave an excellent signal to buy the US dollar during an upward correction. As a result, the instrument grew by more than 50 pips. In the afternoon, the technical picture was slightly revised.
What is needed to open long positions on USD/JPY
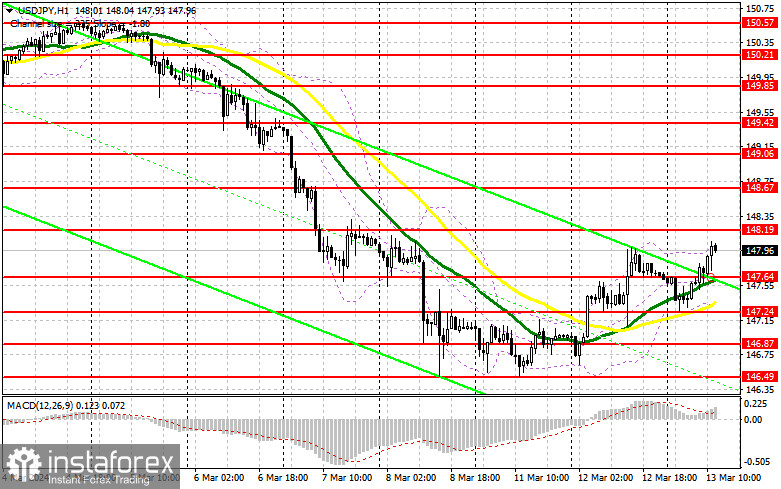
Considering that we do not have any statistics for the US ahead, it is better to look for new dollar buying during declines and corrections. The nearest support at 147.64 is perfect for this, where the moving averages are located, playing on the side of the buyers. A false breakout there will provide a suitable entry point into long positions to update 148.19. There I expect more robust activity from the sellers. A breakout and consolidation above this range will allow the buyers to strengthen their positions in the market, giving them a chance to open long positions with the target of 148.67. The farthest target will be a high of 149.06, where I will take profit. If USD/JPY declines and the buyers are not active at 147.64, the instrument will come under selling pressure. In this case, I will try to enter the market at about 147.24. But only a false breakout there will be a suitable condition for opening long positions. I plan to buy USD/JPY immediately at a dip only from 146.87, bearing in mind a correction of 30-35 pips within the day.
What is needed to open short positions on USD/JPY
In case of further growth of USD/JPY, I expect the bears to appear only in the area of 148.19, where a false breakout will give a good entry point for selling during a movement to support at 147.64, formed at the first half of the trading day. A breakout and reverse test from the bottom up of this area will cause a more serious blow to the bulls, since the bearish market for the dollar has not yet been canceled yet. This will also activate the buyers' stop losses and open the way to 147.24, which will be a significant gain for sellers. A more distant target will be 146.87, where I will take profits. If USD/JPY grows and there is no selling activity at 148.19, the upward correction will continue to develop in the second half of the day. Therefore, it is best to postpone selling until the test of the next resistance at 148.67. If there is no downward movement even there, I will sell USD/JPY immediately during a rebound from 149.06, but only in anticipation of a downward correction by 30-35 pips within the day.
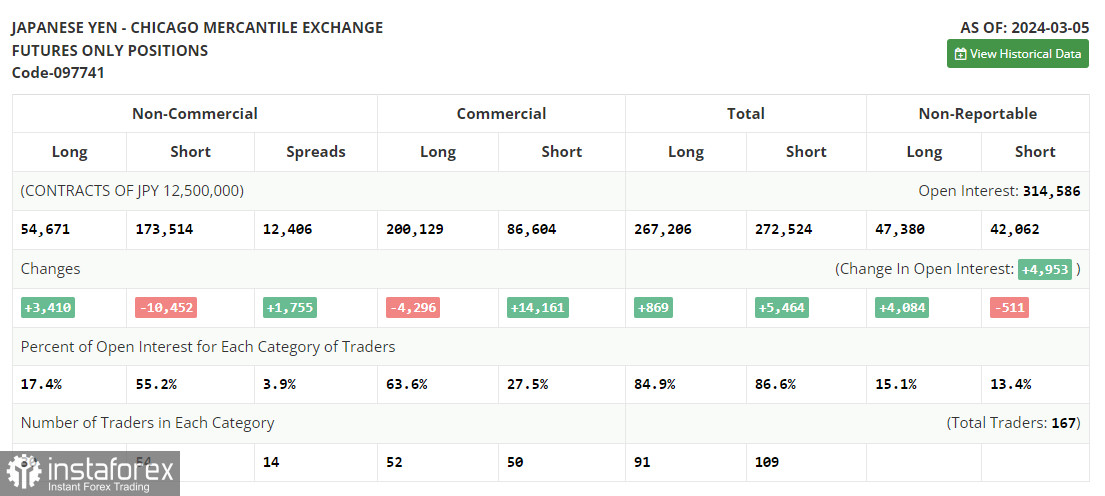
The COT (Commitment of Traders) report from March 5 showed an increase in long positions and a sharp decrease in short positions. Under current circumstances, when the Bank of Japan is seriously talking about the need to tighten the ongoing ultra-loose monetary policy, it is not surprising that traders are adding long positions on the yen. Many traders expect monetary policy adjustments as early as March this year, which will continue to support demand for the safe haven asset. However, do not forget about the Federal Reserve's policy, which now relies on inflation data. A new portion of statistics for February is already available, so market participants are revising trading sentiment on the US dollar. The latest COT report said that long non-commercial positions increased by 3,410 to 54,671, while short non-commercial positions fell by 10,452 to 173,514. As a result, the spread between long and short positions increased by 1,755.
Indicators' signals
Moving averages
The instrument is trading above the 30 and 50-day moving averages. It indicates that the US dollar is striving to regain its footing.
Note: The period and prices of the moving averages are considered by the analyst on the 1-hour chart and differ from the general definition of classic daily moving averages on the daily chart.
Bollinger Bands
In case USD/JPY goes down, the indicator's lower border at about 147.24 will act as support.
Description of indicators
- Moving average (moving average, determines the current trend by smoothing out volatility and noise). Period 50. It is marked yellow on the chart.
- Moving average (moving average, determines the current trend by smoothing out volatility and noise). Period 30. It is marked green on the chart.
- MACD indicator (Moving Average Convergence/Divergence — convergence/divergence of moving averages) Quick EMA period 12. Slow EMA period to 26. SMA period 9
- Bollinger Bands (Bollinger Bands). Period 20
- Non-commercial speculative traders, such as individual traders, hedge funds, and large institutions that use the futures market for speculative purposes and meet certain requirements.
- Long non-commercial positions represent the total long open position of non-commercial traders.
- Short non-commercial positions represent the total short open position of non-commercial traders.
- Total non-commercial net position is the difference between short and long positions of non-commercial traders.


