


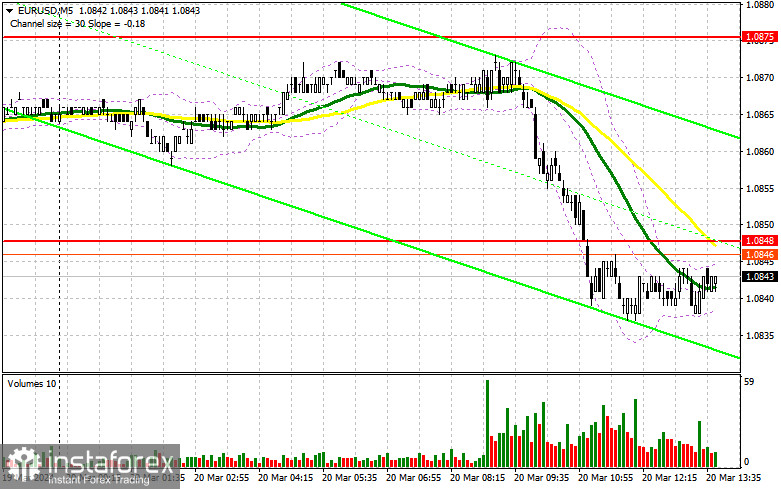
In my morning forecast, I paid attention to the level of 1.0848 and planned to make decisions on entering the market from it. Let's look at the 5-minute chart and try to figure out what happened there. EUR/USD went down, but it never reached the point where a false breakout formed. The instrument did not provide any suitable entry points into the market. For this reason, the technical picture was revised in the afternoon.
What is needed to open long positions on EUR/USD
The Federal Reserve is due to unveil its decision on interest rates this afternoon. So, it's unlikely that there will be any major movements in the market before then. The hawkish rhetoric of the Fed and Chairman Jerome Powell will enable a further decline in EUR/USD and a strengthening of the US dollar. The dovish tone and hints of rate cuts at the beginning of this summer will be the reason to sell the dollar and buy the euro. I plan to act on the dip in the area of new support at 1.0836, formed at the end of the first half of the day. A false breakout there will be a suitable option for buying in anticipation of a breakout to the area of 1.0872, i.e. resistance coinciding with the daily high. A breakout and top-down update of this range amid the Fed's hawkish message will encourage EUR/USD to climb, providing a chance to buy with the target at 1.0906. The farthest target will be a high of 1.0934 where I will take profit. In case of a further decline in EUR/USD and a lack of activity in the area of 1.0836 in the afternoon, the euro will remain under selling pressure that will lead to a further decline with the prospect of updating 1.0800. I plan to enter the market there only after a false breakout. I will open long positions immediately on a dip from 1.0763, bearing in mind an upward correction of 30-35 pips within the day.
What is needed to open short positions on EUR/USD
The sellers are becoming more and more active. If EUR/USD grows after the Fed's decision, only after unsuccessfully consolidating above 1.0872, where the moving averages are located, the bears may enter the market with the prospect of updating the new support at 1.0836. A breakout and consolidation below this area, as well as a reverse test from bottom to top, will give another selling point with a fall of the pair to the level of 1.0800, where the buyers will enter the market actively. The lowest target will be at least 1.0763, where I will take profits. If EUR/USD moves up in the afternoon, and there are no bears at 1.0872, the buyers will get a chance for new growth. In this case, I will postpone selling until the test of the next resistance 1.0906. I will also sell there, but only after unsuccessful consolidation. I plan to open short positions immediately on a rebound from 1.0934, bearing in mind a downward correction of 30-35 pips.
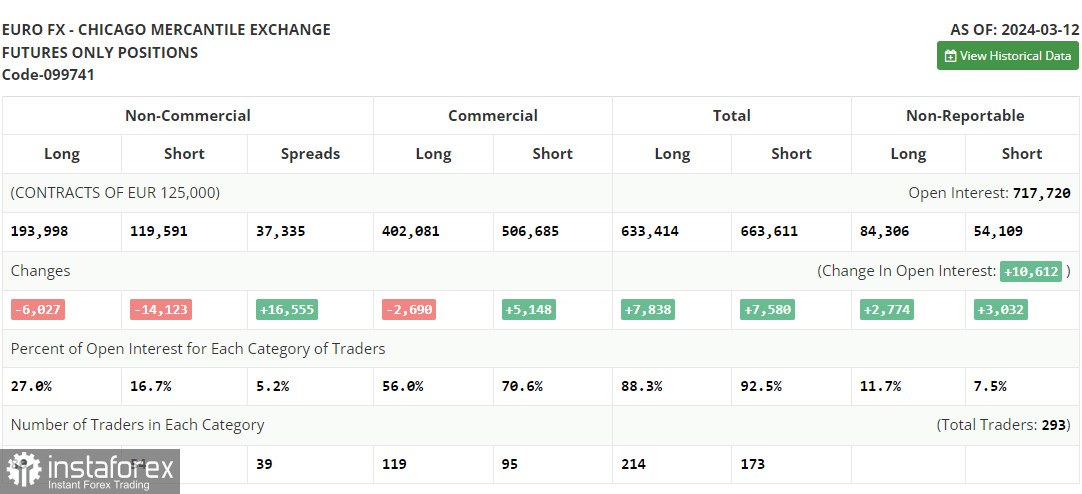
The COT (Commitment of Traders) report for March 12 showed a decrease in both long and short positions. The outcome of the ECB meeting is still putting pressure on risk assets, as traders did not find out any specifics. The released data on inflation in the United States completely convinced market participants that it is still too early to think about lowering interest rates by the Fed. For this reason, I bet on further development of the bullish trend in the US dollar and a decline in the euro. The COT report indicated that long non-commercial positions fell by 6,027 to 193,998, while short non-commercial positions dropped by 14,123 to 119,591. As a result, the spread between long and short positions increased by 16,555.
Indicators' signals
Moving averages
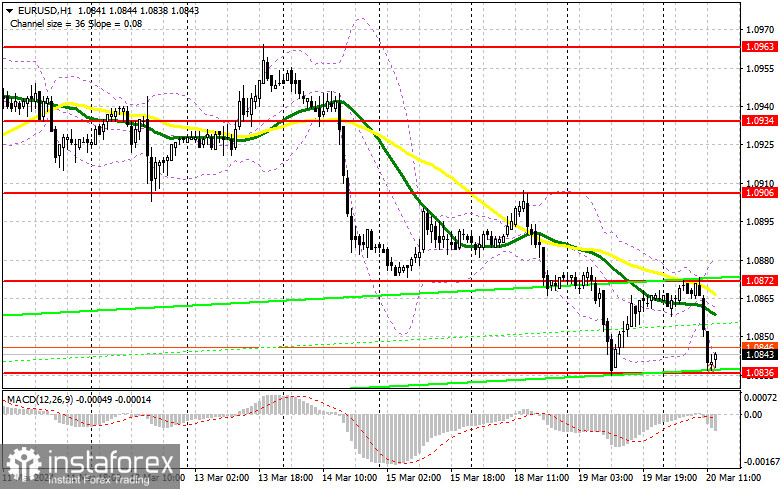
The instrument is trading below the 30 and 50-day moving averages. It indicates a further decline in EUR/USD.
Note: The period and prices of the moving averages are considered by the analyst on the 1-hour chart and differ from the general definition of classic daily moving averages on the daily chart.
Bollinger Bands
In case EUR/USD goes down, the indicator's lower border at about 1.0836 will act as support.
Description of indicators
- Moving average (moving average, determines the current trend by smoothing out volatility and noise). Period 50. It is marked yellow on the chart.
- Moving average (moving average, determines the current trend by smoothing out volatility and noise). Period 30. It is marked green on the chart.
- MACD indicator (Moving Average Convergence/Divergence — convergence/divergence of moving averages) Quick EMA period 12. Slow EMA period to 26. SMA period 9
- Bollinger Bands (Bollinger Bands). Period 20
- Non-commercial speculative traders, such as individual traders, hedge funds, and large institutions that use the futures market for speculative purposes and meet certain requirements.
- Long non-commercial positions represent the total long open position of non-commercial traders.
- Short non-commercial positions represent the total short open position of non-commercial traders.
- Total non-commercial net position is the difference between short and long positions of non-commercial traders.


