The pound seems to have started building the presumed Wave 3 or C, which promises a huge decline. Let me remind you that the minimum targets for this wave are around the 20th figure. Perhaps it's hard for someone to believe that the pound could fall by 600 basis points in the coming months, but haven't we seen remarkable movements in the market? For instance, the dollar's decline over the past 5-6 months. All this time I have often mentioned that the Federal Reserve's stance is shifting towards being more hawkish. The Fed did not start lowering rates in March, and there are serious doubts that they will start easing in June. This only means that the US rate will remain at its peak longer than the market expected. Therefore, the dollar should rise.
But all we have seen in the past six months is a decline from the dollar. I have mentioned that the market can trade in complete accordance with the wave pattern, without even realizing it. Over the past six months, Wave 2 or b was being formed, a corrective wave within the downtrend. It turned out to be very long, but the wave structure is not broken, and waves can be almost any length. Accordingly, nothing terrible happened, I just personally did not expect such a long Wave 2 or b.

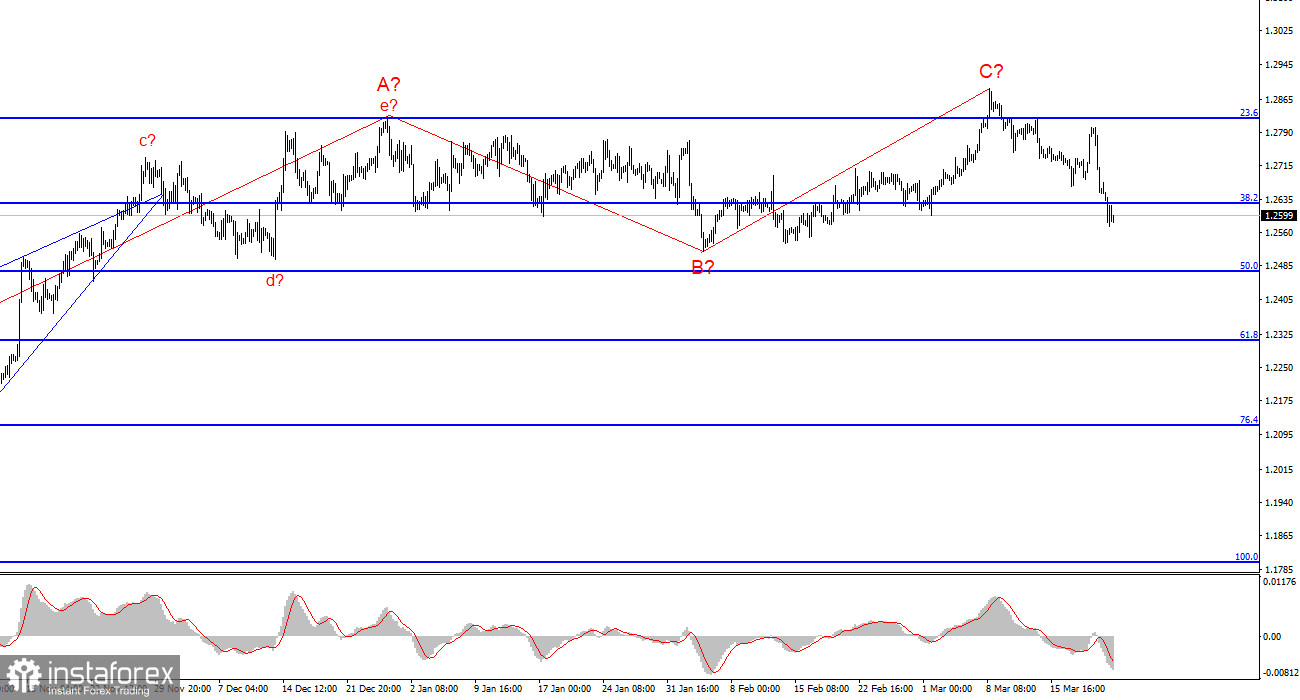
Currently, the pound should fall further. A successful attempt to break through the level of 1.2628, which corresponds to 38.2% Fibonacci, indicates that the pair should likely fall towards the level of 1.2469, which is equivalent to 50.0%. If the pair reaches this level, then the instrument will test its recent low (the low of Wave B in 2 or b). Then we can grow more confident in forming Wave 3 or C.
The upcoming news background in the UK will be weak. The only event will be the final GDP report for the fourth quarter. Most likely, the UK economy will show a decline of 0.3%. In fact, this is a recession. Bank of England Governor Andrew Bailey calls it a "technical recession." This is another reason to sell the pound.
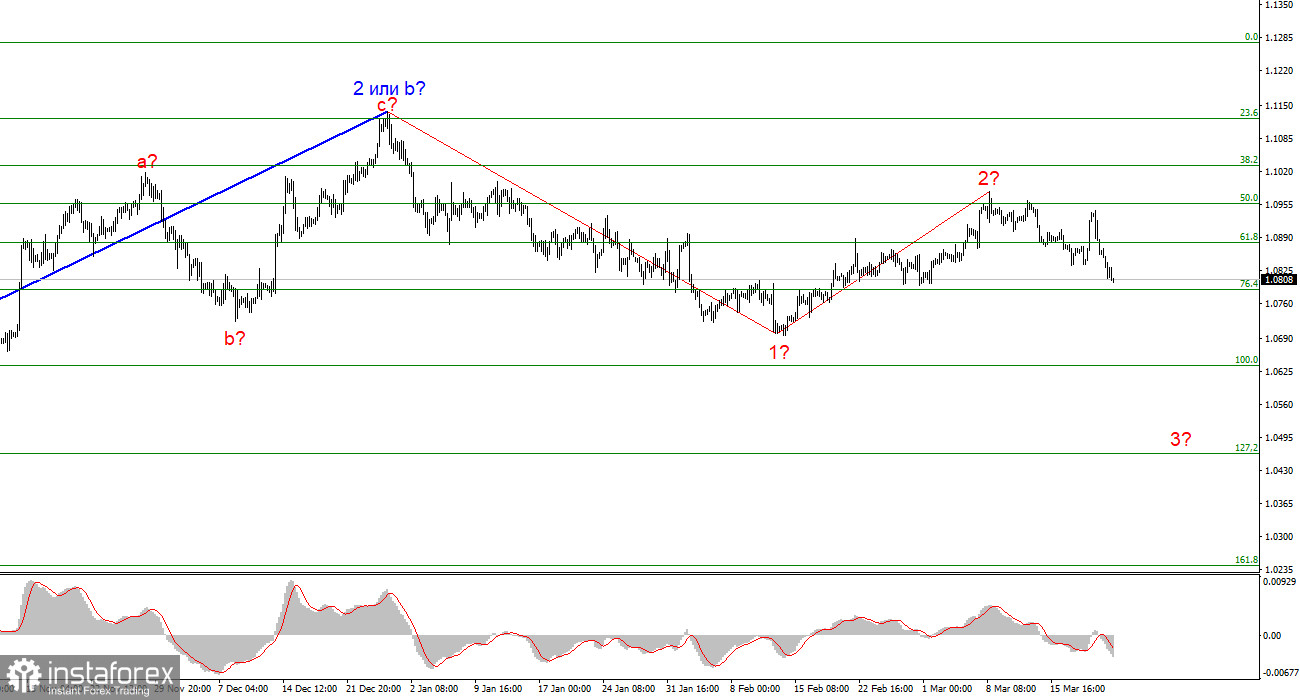
Wave analysis for EUR/USD:
Based on the conducted analysis of EUR/USD, I conclude that a bearish wave set is being formed. Wave 2 or b is complete, so in the near future, I expect an impulsive downward wave 3 or c to form with a significant decline in the instrument. An internal corrective wave is currently being formed, which could have already ended. I am considering short positions with targets near the 1.0462 mark, which corresponds to 127.2% according to Fibonacci.

Wave analysis for GBP/USD:
The wave pattern of the GBP/USD instrument suggests a decline. I am considering selling the instrument with targets below the 1.2039 level, because I believe that wave 3 or c will start sooner or later. However, unless wave 2 or b ends, the instrument can still rise to the level of 1.3140, which corresponds to 100.0% Fibonacci. The construction of wave 3 or c may have already started, but the quotes haven't moved far away from the peaks, so we cannot confirm this.
Key principles of my analysis:
Wave structures should be simple and understandable. Complex structures are difficult to work with, and they often bring changes.
If you are not confident about the market's movement, it would be better not to enter it.
We cannot guarantee the direction of movement. Don't forget about Stop Loss orders.
Wave analysis can be combined with other types of analysis and trading strategies.


