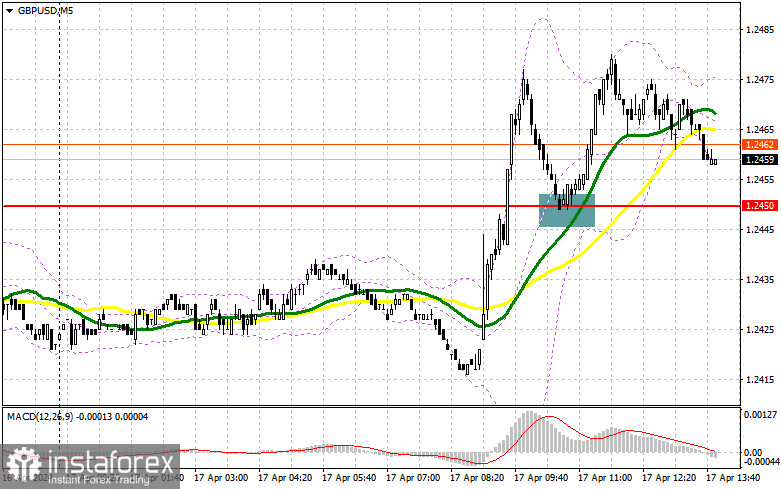
In my morning forecast, I focused on the level of 1.2450 and planned to make trading decisions based on it. Let's look at the 5-minute chart and analyze what happened there. The breakout and reverse test from top to bottom of this range led to a signal to buy the pound in continuation of the morning trend, resulting in the pair rising by more than 30 points. The technical picture remained unchanged for the second half of the day.

To open long positions on GBP/USD, the following is required:
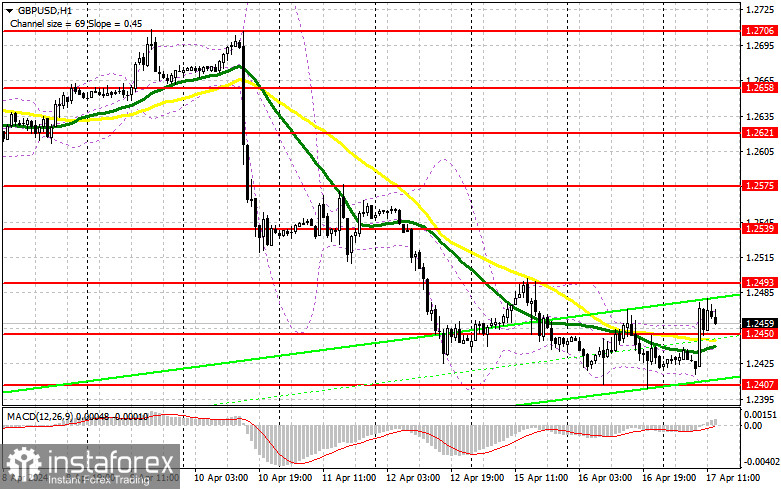
News that inflation in the UK, although decreased, not as quickly as economists expected, led to the strengthening of the British pound in the first half of the day. This allowed the chances of an upward correction of the pair to be maintained, especially against the background of the absence of important US statistics today. Now, buyers will have to prove their presence in the market again, and the formation of a false breakout around 1.2450 will help with this, providing an entry point for buying with the target of rising to the resistance at 1.2493, which we did not reach in the first half of the day. A breakout and test from top to bottom of this range will strengthen the chance of recovery for GBP/USD, leading to new purchases and reaching 1.2539. In case of a breakout above this range, we can talk about a surge to 1.2575, where I plan to take profit. In the scenario of further decline of GBP/USD and absence of buyers at 1.2450 in the second half of the day, and this level has already been tested once today, sellers will have a chance for a larger decline of the pair further along the trend. In this case, I will look for buys around 1.2407. Forming a false breakout will be a suitable option for entering the market. I plan to open long positions on GBP/USD immediately on the rebound from 1.2375, with the target of a correction of 30-35 points within the day.
To open short positions on GBP/USD, the following is required:
Despite the upward correction of the pair, the chances of growth for the pound are extremely low. Of course, it would be desirable to see how sellers will show themselves around the nearest resistance at 1.2493, where a false breakout will provide a suitable entry point for selling the pound in an attempt to push the intermediate support at 1.2450, which has the properties of the middle of the sideways channel, in which we may get stuck in the coming days. A breakout and reverse test from bottom to top at 1.2450 will increase pressure on the pair, giving bears an advantage and another entry point for selling with the target of updating 1.2407 and 1.2375. The ultimate target will be the low of 1.2340, where I will take profit. In the scenario of a GBP/USD rise and the absence of bears at 1.2493 in the second half of the day, bulls can build a fairly good correction with upward movement toward the resistance at 1.2359. I will also look for sales there only on a false breakout. If there is no activity there as well, I recommend opening short positions on GBP/USD from 1.2575 with the expectation of a pair rebound down by 30-35 points within the day.

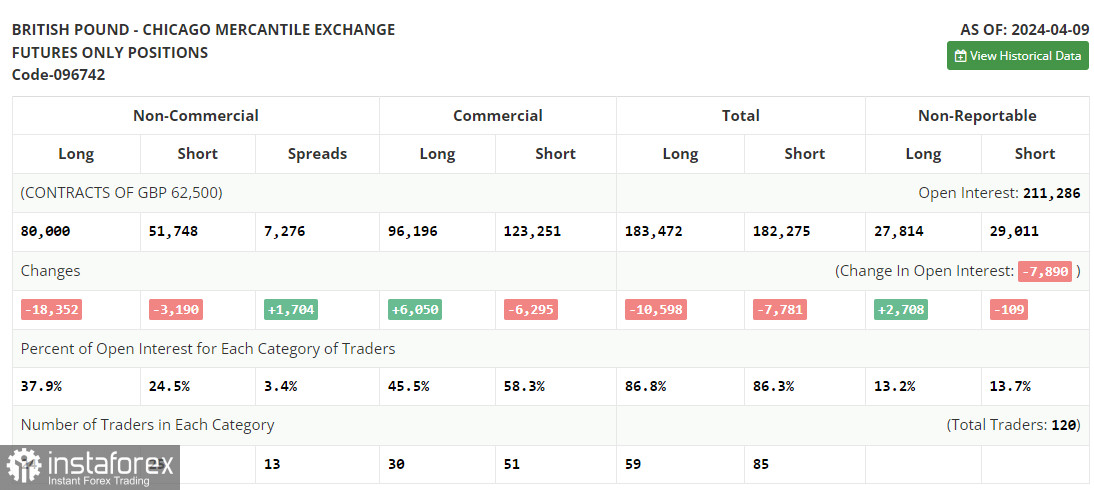
The COT report (Commitment of Traders) for April 9 showed a sharp reduction in long and short positions. Pound buyers left the market faster than sellers, and there are objective reasons for this: the first and main one is high inflationary pressure in the US, which will maintain demand for the dollar, exerting serious pressure on risky assets, including the British pound. The second reason is the soft policy of the Bank of England, which has yet to go anywhere. New statements by regulators could negatively affect the bullish prospects for the pound - especially after the clear position of the ECB last week, which consisted of lowering rates in the eurozone already in early summer this year. In addition, there is a need to maintain a tough stance from the Federal Reserve, and it is hardly worth expecting a strong bullish market in the GBP/USD pair. The last COT report stated that long non-commercial positions decreased by 18,352 to 80,000, while short non-commercial positions decreased by 3,190 to 51,748. As a result, the spread between long and short positions increased by 1,704.

Indicator signals:
Moving averages:
Trading is above the 30 and 50-day moving averages, indicating a rise in the pound.
Note: The author considers the period and prices of moving averages on the hourly chart H1, which differs from the general definition of classic daily moving averages on the daily chart D1.
Bollinger Bands:
In case of decline, the lower boundary of the indicator at around 1.2407 will act as support.
Description of indicators:
- Moving average (determines the current trend by smoothing volatility and noise). Period 50. Marked on the chart in yellow.
- Moving average (determines the current trend by smoothing volatility and noise). Period 30. Marked on the chart in green.
- MACD indicator (Moving Average Convergence/Divergence - convergence/divergence of moving averages) Fast EMA period 12. Slow EMA period 26. SMA period 9
- Bollinger Bands. Period 20
- Non-commercial traders - speculators, such as individual traders, hedge funds, and large institutions using the futures market for speculative purposes and meeting certain requirements.
- Long non-commercial positions represent the total long open position of non-commercial traders.
- Short non-commercial positions represent the total short open positions of non-commercial traders.
- The total non-commercial net position is the difference between non-commercial traders' short and long positions.


