


EUR/USD
Analysis:
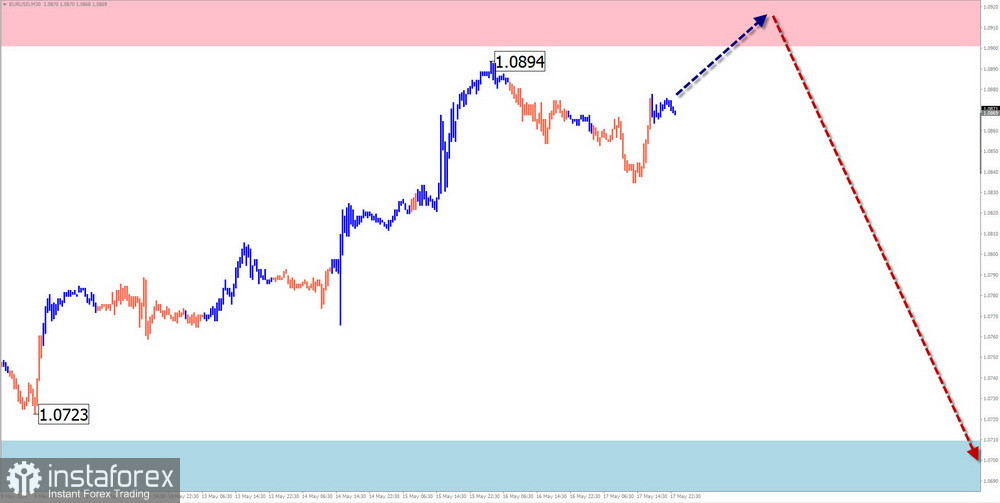
The main pair of the European currency has been forming a "descending pennant" since last summer. Currently, wave (C) is developing. In early May, the price bounced off the upper boundary of a significant potential reversal zone on the weekly timeframe. The correction structure appears complete, but there are no signals of an imminent reversal on the chart.
Forecast:
The euro is expected to move within a narrow corridor between the nearest opposing zones in the coming week. In the initial days, pressure may be on the resistance zone, with a brief breach of its upper boundary not ruled out. Subsequently, a reversal and resumption of the downward trend are anticipated.
Potential Reversal Zones
- Resistance: 0.0900/0.0950
- Support: 1.0710/1.0660
Recommendations:
- Buying: No conditions for such trades.
- Selling: This could become the main trading direction after confirmed reversal signals appear near the resistance zone.
USD/JPY
Analysis:
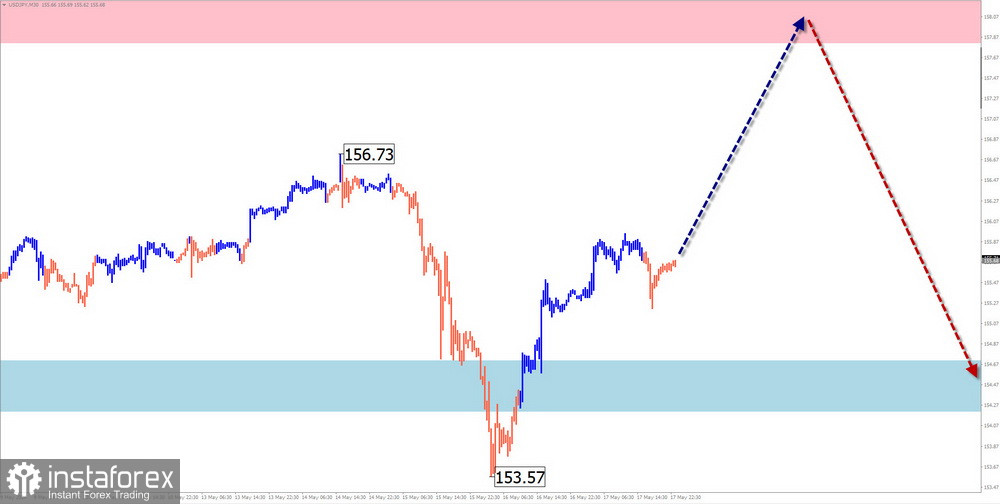
Since December last year, an ascending wave algorithm has determined the overall price movement of the major pair of Japanese yen. The structure analysis shows the formation of a corrective part in late April. The upward segment from May 2nd represents an intermediate pullback. After its completion, another decline is expected.
Forecast:
A slight upward movement is expected at the beginning of the week, with the price reaching the calculated resistance boundaries. A sideways movement is likely in this zone, forming conditions for a direction change. A decline might begin closer to the weekend.
Potential Reversal Zones
- Resistance: 157.80/158.30
- Support: 154.70/154.20
Recommendations:
- Buying: Risky with limited potential.
- Selling: This can be considered after appropriate signals appear near the calculated resistance.
GBP/JPY
Analysis:
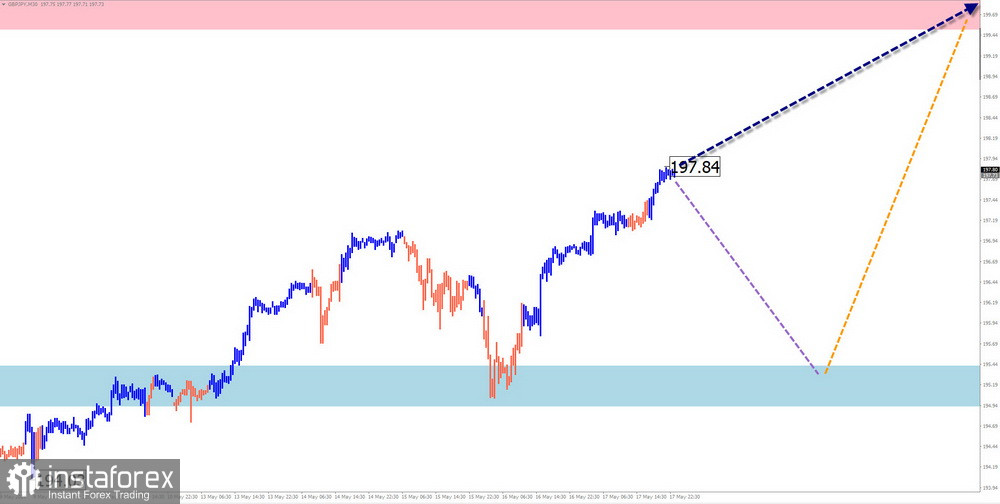
In recent years, the dominant direction in the GBP/JPY pair has been an ascending wave. Its ongoing segment started in December last year. Since late April, a corrective part (B) has been forming, resembling a shifting plane.
Forecast:
Expect a flat movement at the start of the week, with a potential downward vector not exceeding the calculated support boundaries. The bullish trend will likely resume in the week's second half. A volatility spike may occur during the release of economic data.
Potential Reversal Zones
- Resistance: 199.50/200.00
- Support: 195.40/194.90
Recommendations:
- Selling: High risk with low potential; safer to reduce the trading lot.
- Buying: Premature until confirmed signals appear on your trading system.
USD/CAD
Analysis:
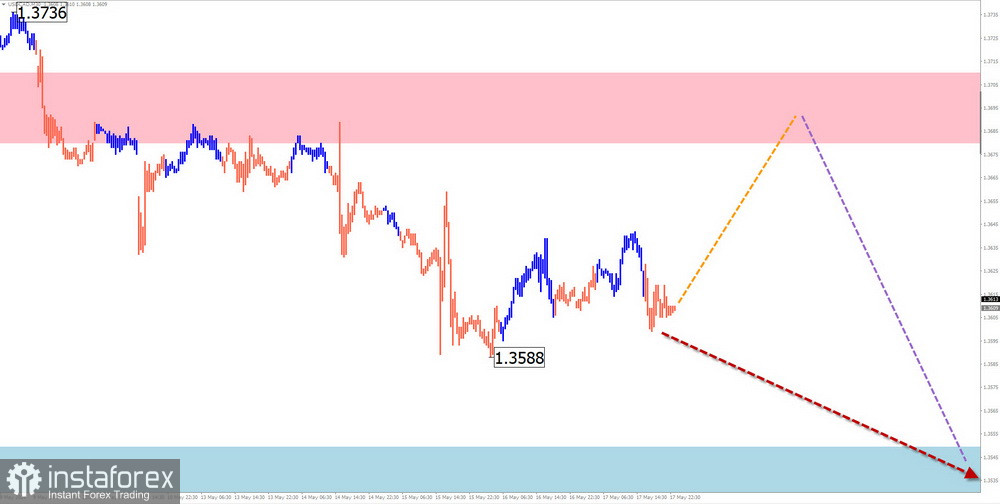
Since September last year, USD/CAD has been drifting sideways. The wave's extremes form a "descending pennant." The structure does not indicate completion. Last week, the pair moved into a flat intermediate pullback.
Forecast:
At the beginning of the week, an upward price movement is likely, with the upper boundary indicated by the calculated resistance. A direction change is likely toward the weekend, with a potential price decline within the weekly period down to the calculated support.
Potential Reversal Zones
- Resistance: 1.3680/1.3730
- Support: 1.3550/1.3500
Recommendations:
- Buying: Possible with a fractional volume in individual sessions.
- Selling: Becomes relevant after confirmed reversal signals appear near the support zone.
NZD/USD
Brief Analysis:
Since late April this year, NZD/USD has been forming a bullish wave. At the end of last week, a corrective pattern, a "shifting plane," began forming within the wave. The descending section from May 16th has reversal potential.
Weekly Forecast:
A bullish movement is likely at the beginning of the week, with the upper boundary indicated by the calculated resistance. In the second half, the likelihood of a direction change increases, with a price decline expected within the weekly period down to the calculated support.
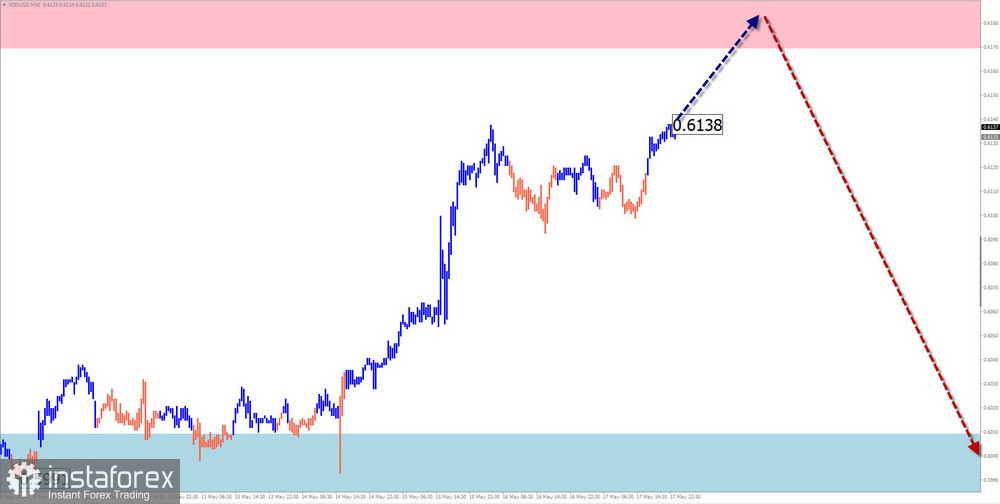
Potential Reversal Zones
- Resistance: 0.6170/0.6220
- Support: 0.6010/0.5960
Recommendations:
- Buying: Possible with a fractional lot in individual sessions.
- Selling: Becomes relevant after confirmed reversal signals appear near the resistance zone.
Gold
Analysis:
Since September last year, gold has been following a bullish wave algorithm. Since December, a corrective from the lower boundary of a significant resistance zone has been forming. The wave extremes form a "shifting plane," lacking a final part.
Forecast:
After likely pressure on the resistance zone, a reversal and a downward movement are expected in the coming days. Active decline is more probable by the end of the week, coinciding with the release of significant economic news.
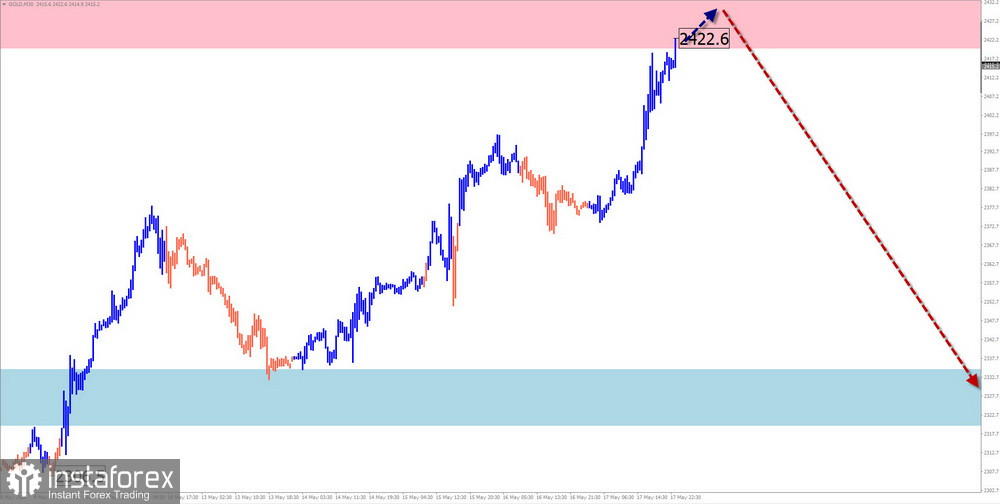
Potential Reversal Zones
- Resistance: 2420.0/2435.0
- Support: 2335.0/2320.0
Recommendations:
- Buying: No conditions for such trades.
- Selling: This can be considered after confirmed reversal signals appear near the resistance zone.
Explanation:
In simplified wave analysis (SWA), all waves consist of 3 parts (A-B-C). The last unfinished wave is analyzed for each timeframe. Expected movements are shown with a dashed line.
Note: The wave algorithm does not account for the duration of instrument movements over time.


