


GBP/USD
Analysis:
Since April 22, the main pair of the British pound has been moving upward on the price chart. The quotes form a counter-correction with reversal potential from the potential reversal zone's lower boundary. If confirmed, the short-term trend direction of the pair will change.
Forecast:
In the next couple of days, we can expect a change in the course of the major pair of the British pound. There may be pressure on the calculated resistance, with a brief breach of its upper boundary. At the end of the week, the chance for a reversal and resumption of the price decline will appear.
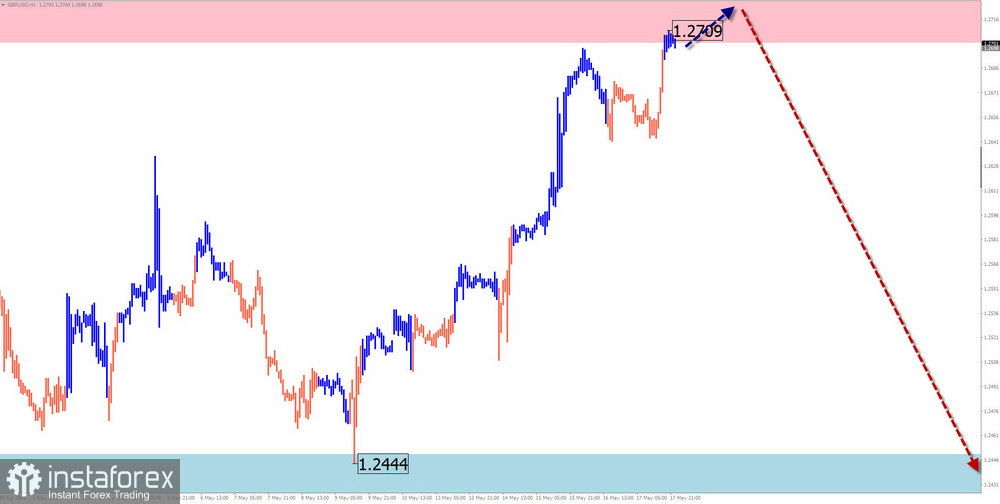
Potential Reversal Zones
- Resistance: 1.2700/1.2750
- Support: 1.2450/1.2400
Recommendations:
- Buying: High risk with no potential.
- Selling: This will become relevant for trades after confirmed reversal signals appear near the resistance zone.
AUD/USD
Analysis:
The unfinished large-scale wave structure on the Australian dollar chart has a downward vector, starting from July 13 last year. Since April this year, a corrective upward wave has been forming, with no signs of imminent completion. The price is trapped in a narrow corridor between strong opposing zones.
Forecast:
A continuation of the rise is likely in the next couple of days. Pressure on the calculated resistance zone cannot be ruled out. In the second half of the week, a change in direction can be expected, with a price decline anticipated towards the weekend.
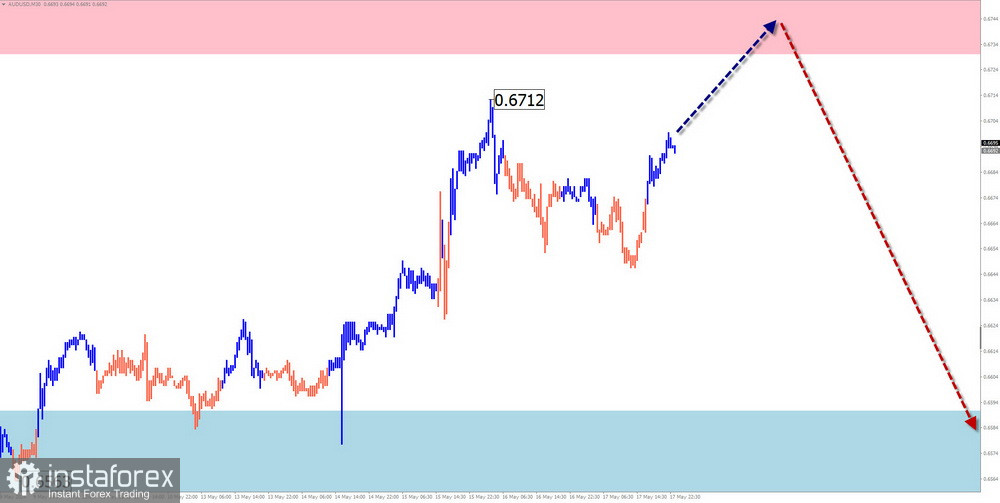
Potential Reversal Zones
- Resistance: 0.6730/0.6780
- Support: 0.6590/0.6540
Recommendations:
- Buying: Limited potential may lead to losses.
- Selling: This can be used for trades after confirmed trend change signals appear near the resistance zone.
USD/CHF
Analysis:
Since December last year, the Swiss franc has strengthened the main pair. Quotes are approaching the upper boundary of a strong resistance zone on the higher timeframe. Since the beginning of May, the price has been correcting downward, and the correction is nearing completion. The calculated resistance is within the potential reversal zone on the daily timeframe.
Forecast:
The downward movement is likely to continue in the first half of the upcoming week. Then, a reversal formation, predominantly sideways, can be expected. Price growth resumption is anticipated closer to the weekend.
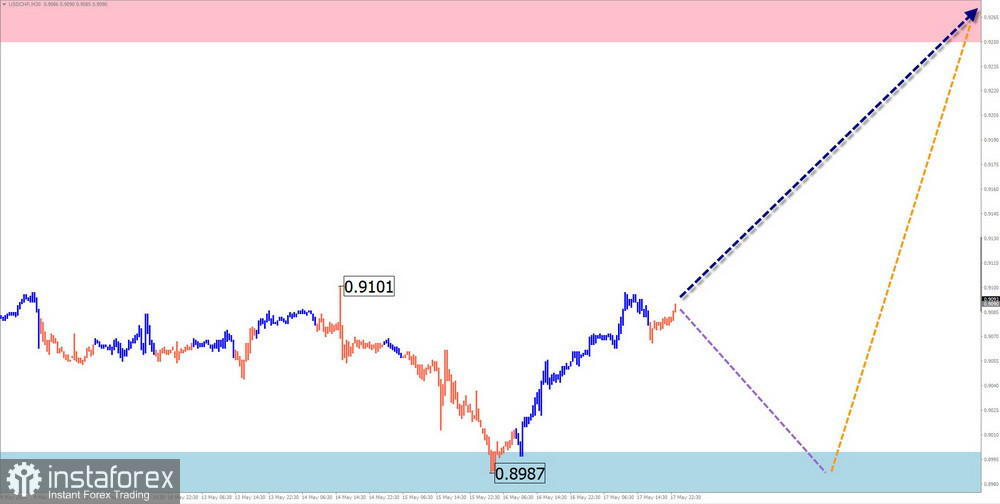
Potential Reversal Zones
- Resistance: 0.9250/0.9300
- Support: 0.9000/0.8950
Recommendations:
- Buying: Limited potential, high risk.
- Selling: Premature until confirmed trend change signals appear near the resistance zone.
EUR/JPY
Analysis:
For the past three years, an ascending wave algorithm has determined the trend direction of the euro/yen cross pair. In the short term, the unfinished segment of the main trend has been ongoing since December last year. A correction has been forming since the end of April, primarily developing in a sideways plane.
Forecast:
The pair price is likely to move slightly upward in the coming days. Near the resistance zone, a sideways transition and reversal conditions are expected. During the trend change, a brief breach of the upper boundary of the zone is possible. A decline may start towards the end of the week.
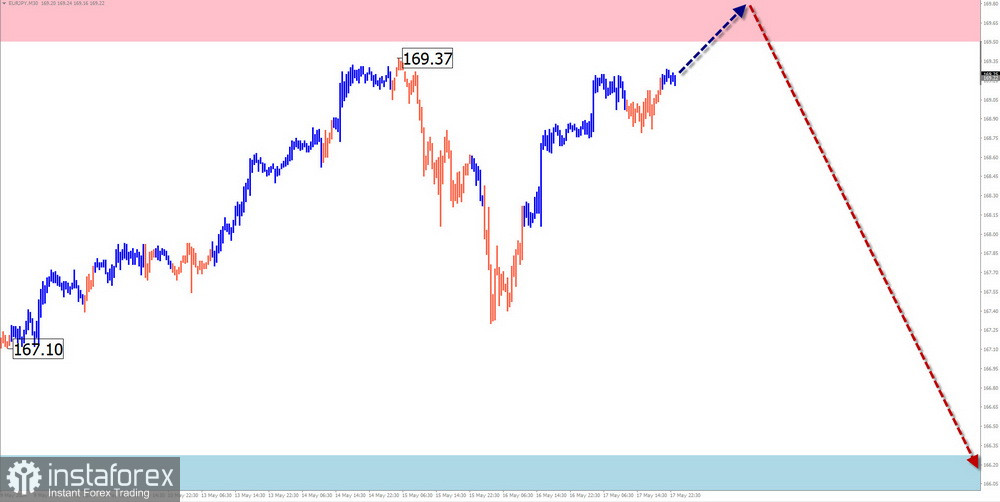
Potential Reversal Zones
- Resistance: 169.50/170.00
- Support: 166.30/165.80
Recommendations:
- Buying: Possible with a fractional volume in individual sessions. Potential limited by calculated resistance.
- Selling: Premature until confirmed reversal signals appear near the resistance zone.
EUR/GBP
Analysis:
The euro in pair against the British pound continues to move sideways. Since December last year, a descending wave algorithm has determined the overall direction of short-term price fluctuations. Throughout the year, quotes have been forming a correction in a sideways corridor between the nearest opposing zones.
Forecast:
At the beginning of the week, pressure on the support zone is possible, though a breach of the lower boundary is unlikely. In the second half, a reversal and resumption of price rises can be expected.
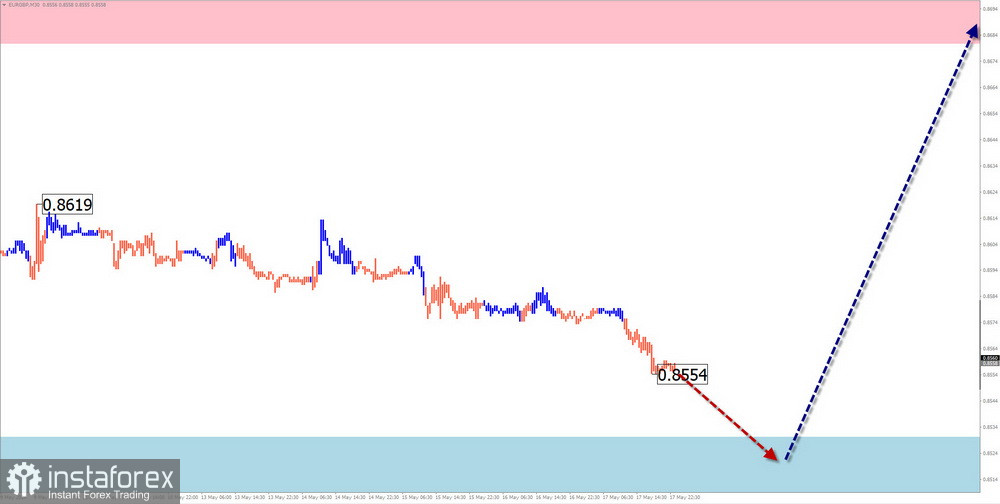
Potential Reversal Zone
- Resistance: 0.8680/0.8730
- Support: 0.8530/0.8480
Recommendations:
- Selling: The potential for such trades is exhausted.
- Buying: Wait for confirmed reversal signals near the support zone for trades.
US dollar index
Analysis:
Since April 16, fluctuations in the dollar index have formed an unfinished downward wave. Quotes reached the upper boundary of a strong potential reversal zone, forming a stretched corrective plane. Last week, quotes formed an upward segment with reversal potential.
Forecast:
The index's current upward trend will end in the upcoming week. After a probable decline to the support zone, a resumption of the rise can be expected up to the calculated resistance boundaries. A sideways transition and reversal formation can be expected after that.
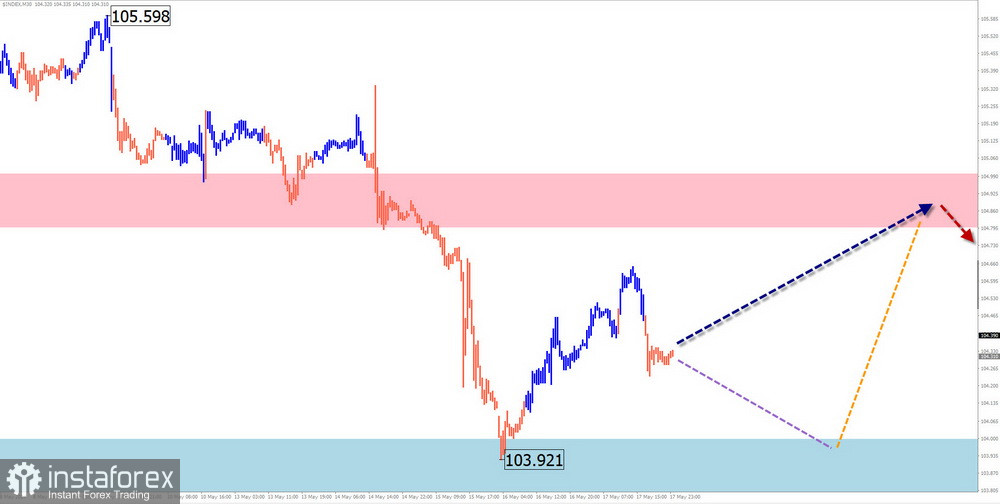
Potential Reversal Zones
- Resistance: 104.80/105.00
- Support: 104.00/103.80
Recommendations:
The US dollar's weakening has entered its final phase. After the upcoming decline, a trend change can be expected.
Explanation:
In simplified wave analysis (SWA), all waves consist of 3 parts (A-B-C). The last unfinished wave is analyzed for each timeframe. Expected movements are shown with a dashed line.
Note: The wave algorithm does not account for the duration of instrument movements over time.


