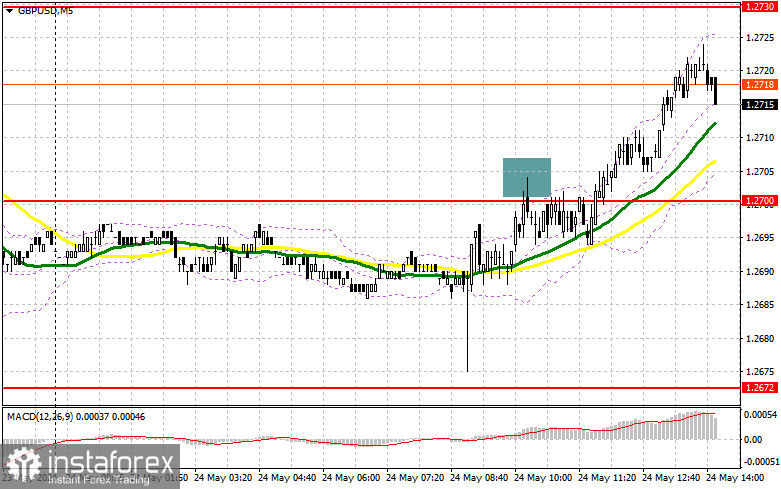
In my morning forecast, I paid attention to the 1.2700 level and planned to decide to enter the market from it. Let's look at the 5-minute chart and figure out what happened there. The growth and formation of a false breakdown there gave a sell signal, but it never reached a normal downward movement, after which the bulls achieved a breakdown of 1.2700, continuing the pair's growth. In the afternoon, the technical picture still needed to be revised.

To open long positions on GBP/USD, you need:
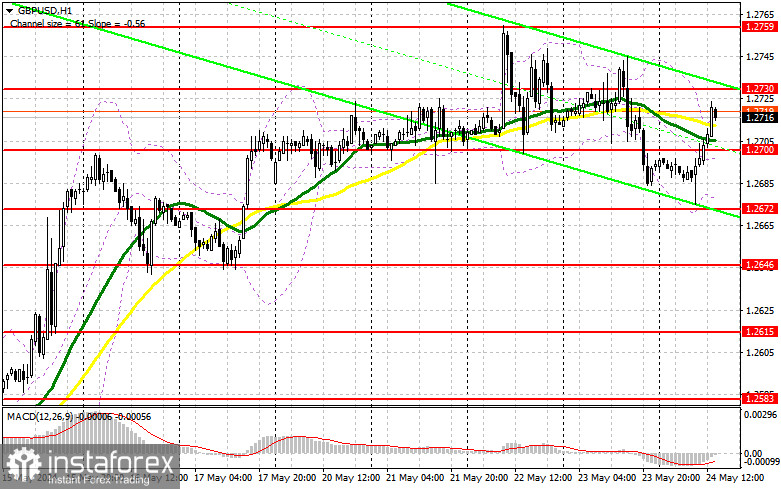
Reports on the United States can harm the upward potential of the pound, so pay special attention to them. Figures are expected on changes in the volume of orders for durable goods, the consumer sentiment index, and inflation expectations from the University of Michigan. In addition, the speech of one of the Fed representatives may also affect the direction of the pound, which must be considered. Strong data will return pressure on the pair, so they will consider long positions only after forming a false breakdown in the support area of 1.2700, which acted as resistance in the morning. This will be the starting point for entering long positions, aiming for an update to 1.2730. A breakthrough and top-down test of this range will allow GBP/USD to rise further, with the next target being 1.2759 - the new resistance and monthly high. A break above this range could surge to 1.2800, where I plan to take profits. If GBP/USD falls and there are no buyers at 1.2700 in the second half of the day, the pressure on the pound will return, leading to a move down to the lower boundary of the sideways channel at 1.2672. A false breakout formation there will be a suitable entry point. I plan to open long positions on GBP/USD immediately on a bounce from 1.2646 with a target of a 30-35 points upward correction within the day.
To open short positions on GBP/USD:
If there is a bullish reaction to the data, I plan to act around the nearest resistance at 1.2730. Only a false breakout formation there will provide an entry point for short positions, aiming for a decline in GBP/USD to the support at 1.2700. A breakout and retest from the bottom up of this range will increase the pressure on the pair, giving the bears an advantage and another entry point for selling, targeting 1.2672, where I expect more active buyer participation. The furthest target will be the 1.2646 low, negating all the bulls' efforts from the past week. I will take profits there. If GBP/USD rises and there are no bears at 1.2730 in the second half of the day, which is more likely, the buyers will regain the initiative, with a chance to update 1.2759 again. I will also sell there only on a false breakout. If there is no activity, I advise opening short positions on GBP/USD from 1.2800, aiming for a 30-35 points downward correction within the day.

COT Report (Commitment of Traders):
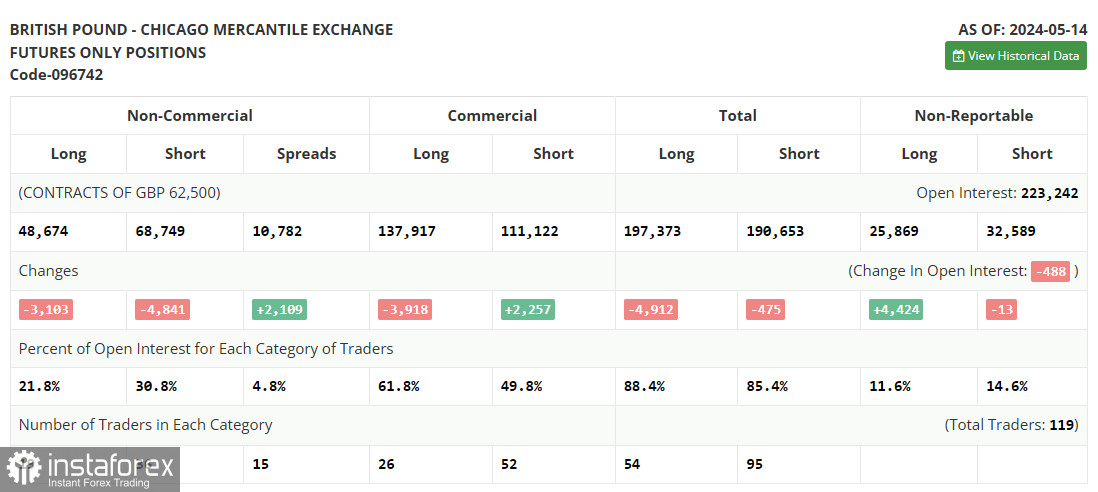
The COT report for May 14 showed a decrease in both long and short positions. It is clear that ahead of decisive actions by the Bank of England, which is likely on the path of lowering interest rates and preparing the market for this, traders prefer to close positions. GDP and inflation data now indicate a smooth reduction in borrowing costs, but how to proceed is a serious question. An overly soft policy could lead to serious problems and inflationary pressure that the regulator must still address fully. Against this backdrop, expecting new highs for the pound is possible but will be challenging. The latest COT report indicates that long non-commercial positions decreased by 3,103, to 48,674, while short non-commercial positions fell by 4,841, to 68,749. As a result, the spread between long and short positions increased by 2,109.
Indicator Signals:
Moving Averages:
Trading is around the 30 and 50-day moving averages, indicating problems for pound buyers.
Note: The author considers the period and prices of moving averages on the H1 hourly chart and differs from the general definition of classic daily moving averages on the D1 daily chart.
Bollinger Bands:
In case of a decline, the lower boundary of the indicator, around 1.2672, will act as support.
Description of Indicators:
- Moving average (MA): Defines the current trend by smoothing volatility and noise. Period – 50. Marked in yellow on the chart.
- Moving average (MA): Defines the current trend by smoothing volatility and noise. Period – 30. Marked in green on the chart.
- MACD (Moving Average Convergence/Divergence): Fast EMA – period 12. Slow EMA – period 26. SMA – period 9.
- Bollinger Bands: Period – 20.
- Non-commercial traders: Speculators like individual traders, hedge funds, and large institutions use the futures market for speculative purposes and meet certain requirements.
- Long non-commercial positions: Represent the total long open positions of non-commercial traders.
- Short non-commercial positions: Represent the total short open positions of non-commercial traders.
- Total non-commercial net position: The difference between short and long positions of non-commercial traders.


