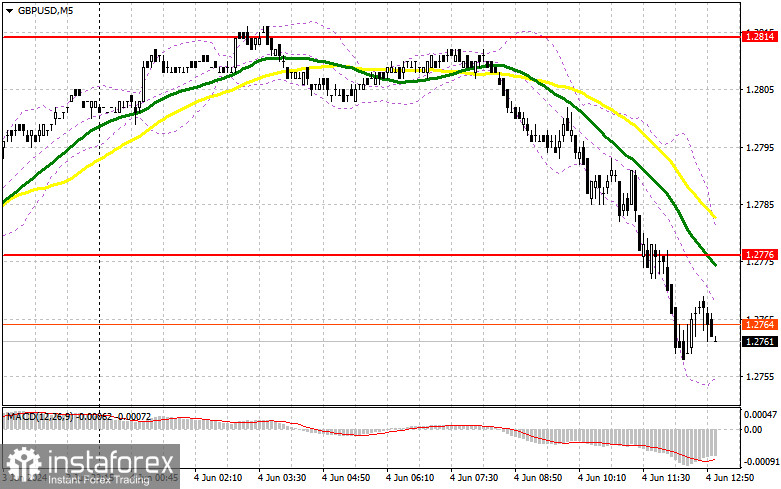
In my morning forecast, I paid attention to the level of 1.2776 and planned to decide to enter the market from it. Let's look at the 5-minute chart and figure out what happened there. The decline to the area of 1.2776 occurred, but it never reached the formation of a false breakdown there, which did not allow entering the market. The complete absence of bulls at this level was surprising, which led to a slight revision of the technical picture for the afternoon.

To open long positions on GBP/USD, you need:
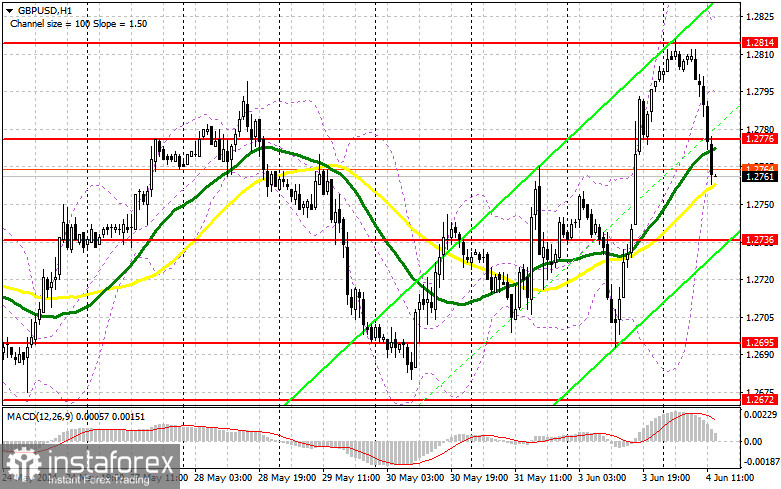
The lack of data for the UK and the lack of bull activity in the area of 1.2776 – all resulted in a major sell-off of the pair. Now, we can only hope for weak statistics on the United States, which will be able to stop, even for a while, the observed fall in the pound. Figures on the vacancy rate and labor turnover from the Bureau of Labor Statistics, changes in the volume of production orders and the economic optimism index from RCM/TIPP are expected. On the contrary, strong data will sink the pound even more, so the main focus on buying is still at the level of 1.2736. Only a false breakout forming there will provide a good entry point for long positions, aiming for a return to the 1.2776 level, formed based on the results of the first half of the day. A breakout and test from above this range will offer a chance for GBP/USD to rise with a target of updating 1.2814. If the pair moves above this range, which is unlikely, we can consider a jump to 1.2853, where I plan to take profit. In the scenario of further GBP/USD decline and the absence of buyers at 1.2736 in the second half of the day, pressure on the pound will only increase, leading to a move down to the support area of 1.2695. Forming a false breakout will create a suitable entry point for the market. Opening long positions on a bounce can be done from 1.2672, targeting a correction of 30-35 points within the day.
To open short positions on GBP/USD:
If the pair rises amid weak US statistics, which cannot be ruled out, I plan to act only after forming a false breakout around the new resistance of 1.2776, which acted as support in the morning. This will confirm the presence of large sellers in the market and provide an entry point for short positions, targeting a further decline in GBP/USD to the support area of 1.2736. A breakout and retest from below this range will increase pressure on the pair, giving bears an advantage and another entry point for sale targeting 1.2695, where I expect more active buyer participation. The furthest target will be the minimum at 1.2672, indicating the formation of a new bearish trend. There, I will take profit. In the scenario of GBP/USD rising and the absence of bears at 1.2776 in the second half of the day, buyers will regain the initiative, aiming to update 1.2814. I will sell there only on a false breakout. If there is no activity, I advise opening short positions from 1.2853, expecting a bounce down by 30-35 points within the day.


Indicator Signals:
Moving Averages
Trading occurs around the 30 and 50-day moving averages, indicating a sideways market.
Note: The author considers the period and prices of moving averages on the hourly chart (H1) and differs from the general definition of classic daily moving averages on the daily chart (D1).
Bollinger Bands
In case of a decline, the indicator's lower boundary, around 1.2753, will act as support.
Indicator Descriptions:
- Moving Average (MA): Determines the current trend by smoothing volatility and noise. Period 50. Marked in yellow on the chart.
- Moving Average (MA): Determines the current trend by smoothing volatility and noise. Period 30. Marked in green on the chart.
- MACD Indicator (Moving Average Convergence/Divergence): Fast EMA period 12. Slow EMA period 26. SMA period 9.
- Bollinger Bands: Period 20.
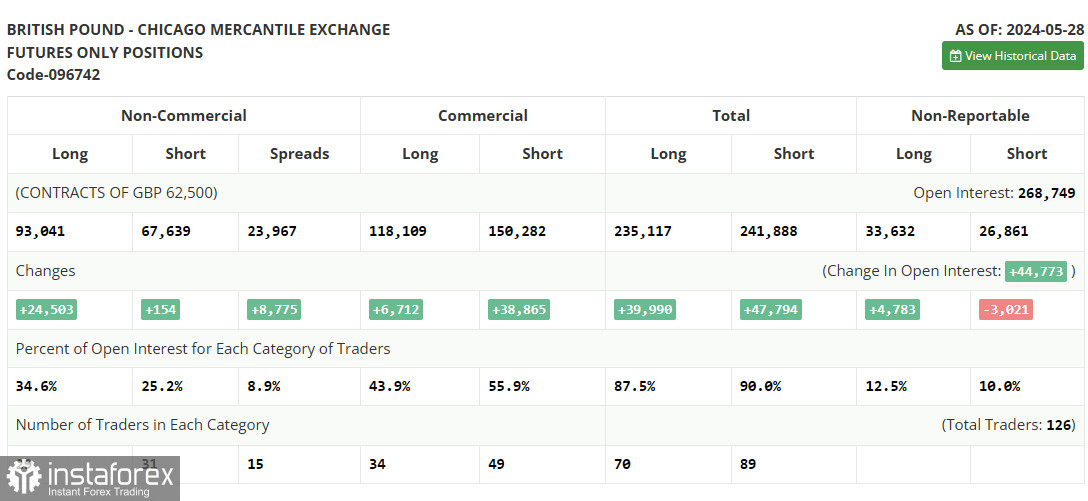
- Non-Commercial Traders: Speculators such as individual traders, hedge funds, and large institutions use the futures market for speculative purposes and to meet specific requirements.
- Long Non-Commercial Positions: Represent the total long open positions of non-commercial traders.
- Short Non-Commercial Positions: Represent the total short open positions of non-commercial traders.
- Total Non-Commercial Net Position: The difference between short and long positions of non-commercial traders.


