EUR/USD

Higher timeframes
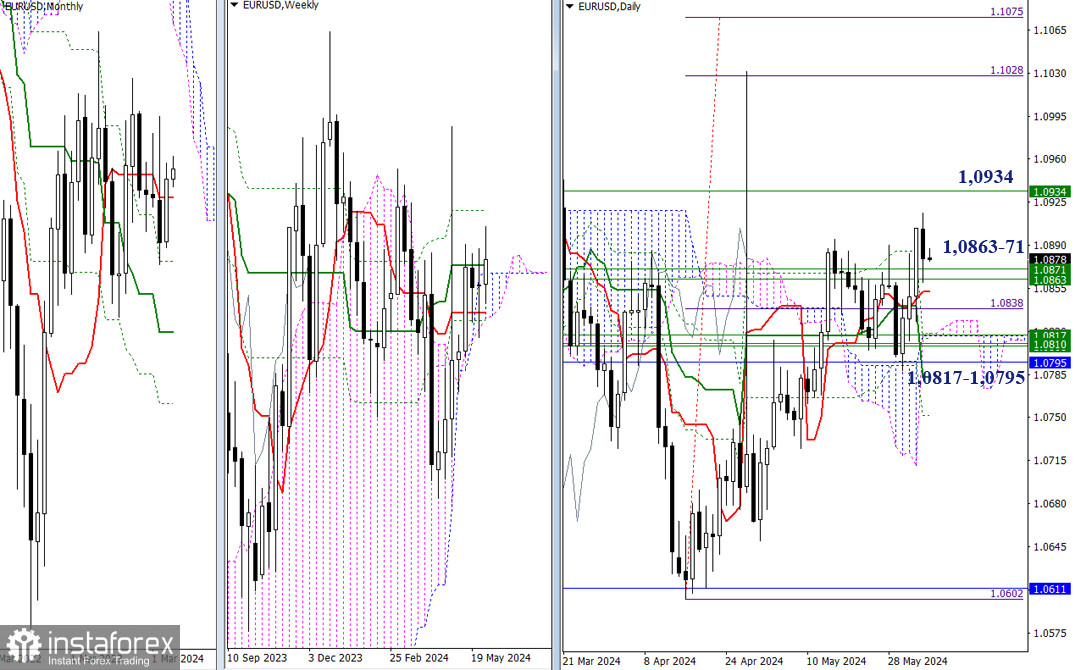
After testing the May peak (1.0895) on Tuesday, the bulls failed to hold their positions and executed a retest of the weekly levels it passed the day before (1.0863-71). If it doesn't have more potential, then the bulls, bouncing off the support levels, will be able to restore their positions and continue the upward movement. At the moment, the next bullish target is the resistance of the final level of the weekly Ichimoku dead cross (1.0934). However, if testing these support levels ends with a breakout, then the market will go through the support of the daily short-term trend (1.0852), and in order to strengthen the bearish sentiment, they will need to overcome the cluster of several supports n the area of 1.0817 - 1.0795.

H4 – H1
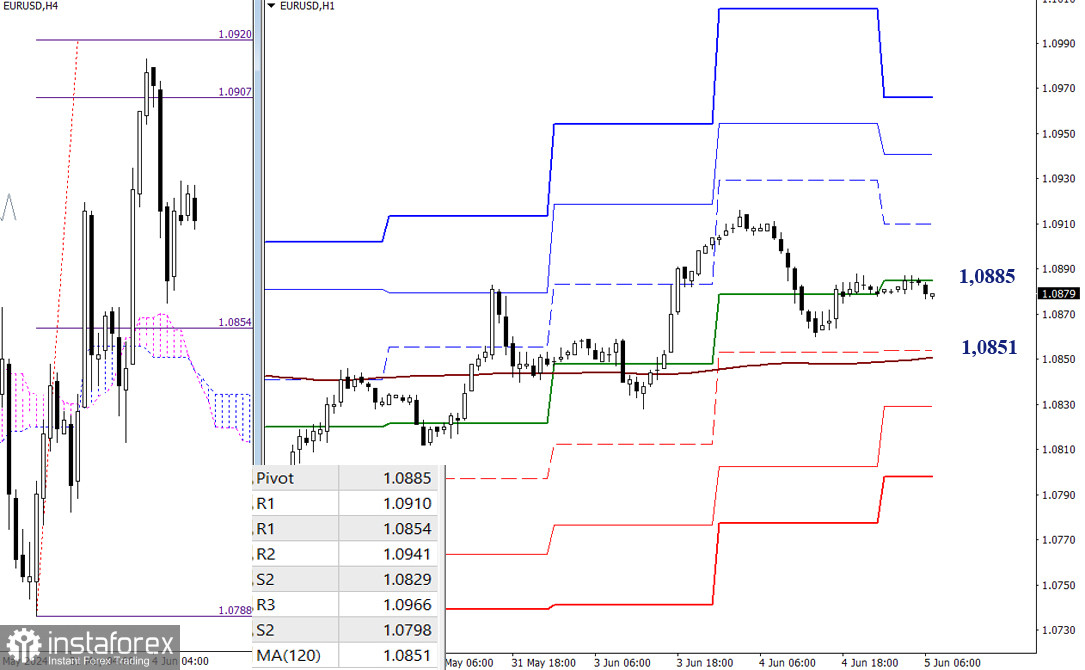
The pair is currently in a corrective area on the lower timeframes, influenced by the central Pivot level of the day (1.0885). Bulls will work on the upward movement by passing the resistances of the classical Pivot levels (1.0910 – 1.0941 – 1.0966). In case the pair corrects lower, the most significant support will be the weekly long-term trend (1.0851). A breakout can change the current balance of power, and the bears will have the main advantage. Other targets for further intraday declines are found at the supports of the classical Pivot levels (1.0829 – 1.0798).
***
GBP/USD

Higher Timeframes
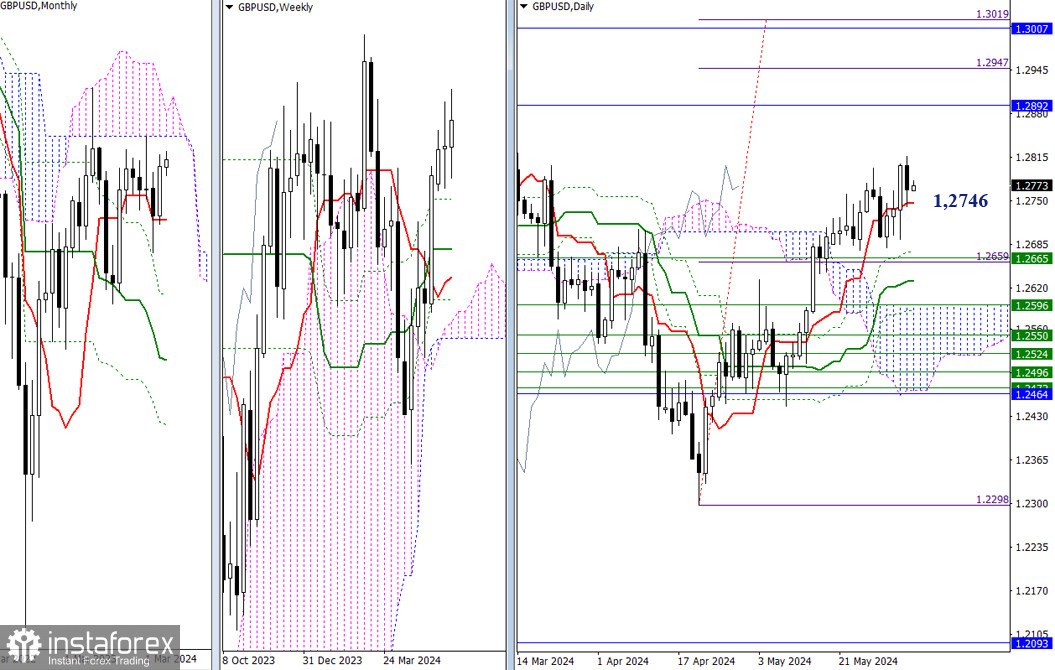
The bulls have stopped rising. Yesterday, the GBP/USD pair slightly retreated, and the support of the daily short-term trend (1.2746) was tested. In the current situation, it is important to break free from the influence of the daily Tenkan. If the bulls manage to do so, their targets can be found at the levels of 1.2892 – 1.3007 (monthly Ichimoku cloud) and 1.2947 – 1.3019 (target for breaking through the daily Ichimoku cloud). If the bears become more active, their next target will be around the weekly support at 1.2665.

H4 – H1
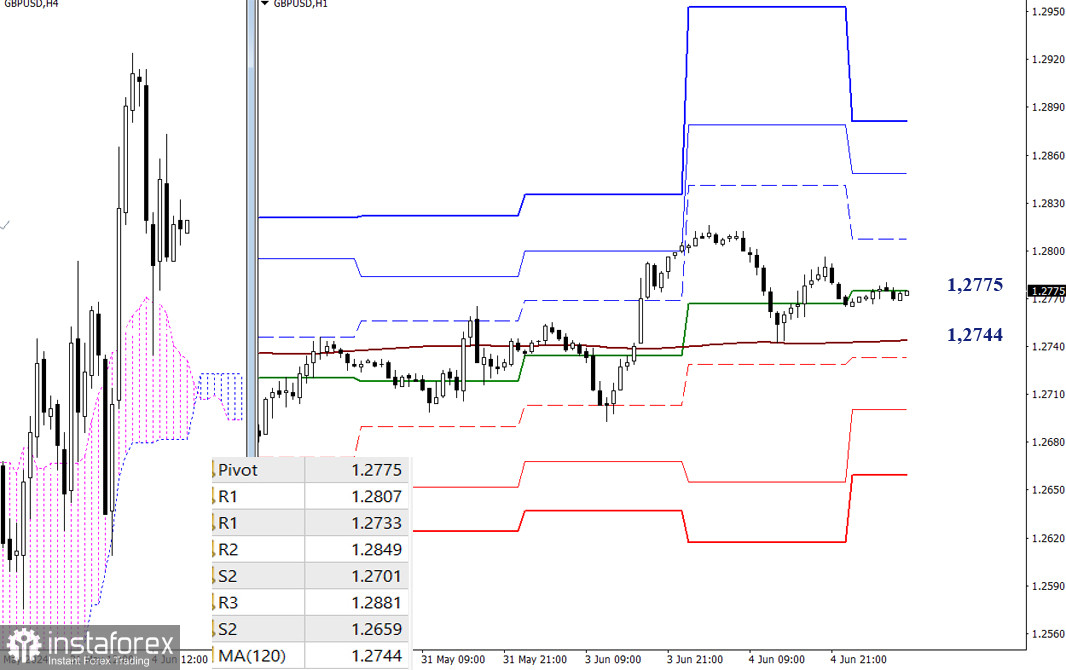
On the lower timeframes, the pair is currently in the central Pivot level of the day (1.2775). The weekly long-term trend (1.2744) is in a horizontal position, indicating general market uncertainty. Staying above the trend still provides some advantage to the bulls. Today, their targets for an intraday upward movement are located at the levels of 1.2807 – 1.2849 – 1.2881 (resistances of classical Pivot levels). Keeping the price below the weekly long-term trend will strengthen the bearish bias. The downward targets on the lower timeframes are the supports of the classical Pivot levels (1.2733 – 1.2701 – 1.2659).
***
The technical analysis of the situation uses:
Higher timeframes - Ichimoku Kinko Hyo (9.26.52) + Fibonacci Kijun levels
Lower timeframes - H1 - Pivot Points (classic) + Moving Average 120 (weekly long-term trend)


