


GBP/USD traded relatively calmly on Tuesday. Despite the fact that the pair showed around 100 pips of volatility on Monday, such cases have been rare in recent months, as we can see from the chart below. We want to remind you that normally, 100-110 pips of volatility a day is considered an average value for the British currency. That's why many traders choose to work with it - the pair shows good movements. But in recent months, volatility has not exceeded 70 pips, and the price has been moving almost in one direction.
Yesterday, the pair started to fall early in the morning. There were no macroeconomic reasons behind such a movement, as the only report of the day - JOLTs in the US - was published closer to the evening. Of course, this movement could be attributed to a technical correction after the sharp rise on Monday. However, we want to draw your attention to the fact that the market vigorously reacts to any news that can exert pressure on the dollar, continues to buy the pair if any report is considered neutral, and does nothing if the economic reports support the US dollar. The best we've seen in recent months are just minor pullbacks to the downside. This is all the greenback can count on as of the moment.
This week, the US will publish several important reports, while in the UK, business activity indices will continue to be released. Today, the US docket will feature important reports on ISM services and the ADP's nonfarm employment change (comparable to NonFarm Payrolls). We already saw the market's reaction to the ISM manufacturing index on Monday. Although the ADP report is only the "younger brother" of NonFarm Payrolls, if its value is weaker than expected, this may exert pressure on the dollar as well. Therefore, as we have mentioned before, the greenback may only rise due to very strong US data.
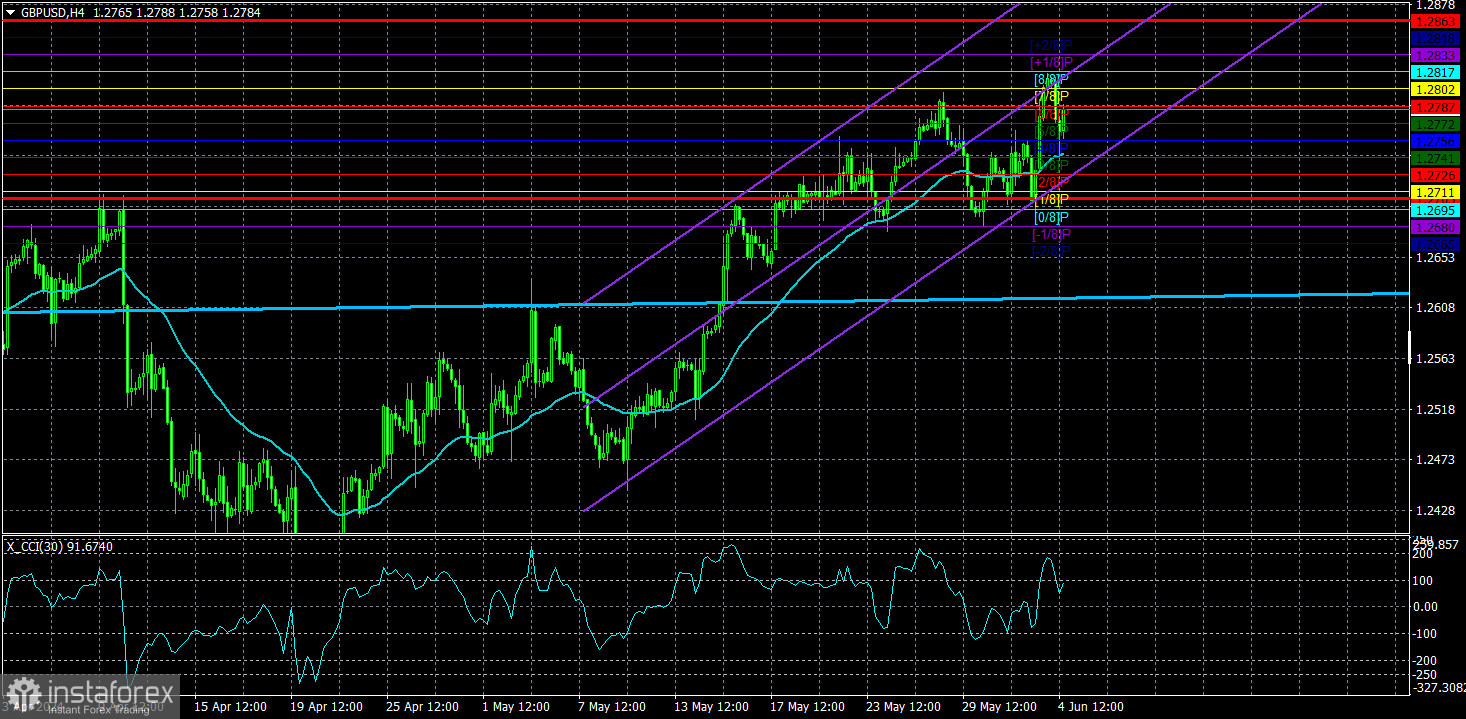
It's very difficult to say how long this will last. The market (or individual participants like market makers) continue to ignore the fundamental background, according to which the Bank of England will start easing monetary policy much earlier than the "expected time", and the Federal Reserve much later on. On the 24-hour timeframe, the pair has already exceeded the important 61.8% Fibonacci level but continues to trade very chaotically overall. There is no logic behind the pair's movements. On this timeframe, it's even difficult to determine the current trend. Therefore, traders should consider the current nature of the pair's movement before they make decisions. This can protect them from losses. Even if the macroeconomic background currently supports growth, the fundamental background supports a decline. Therefore, the GBP/USD pair could start falling at any moment.
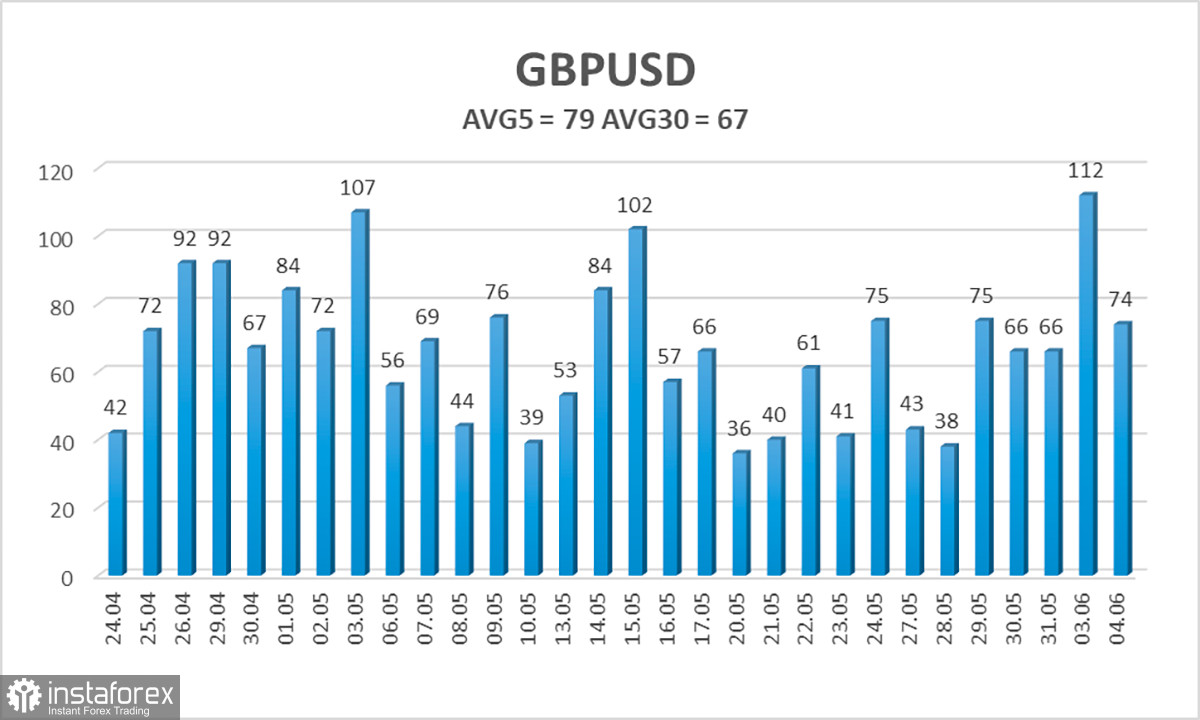
The average volatility of GBP/USD over the last five trading days is 79 pips. This is considered an average value for the pair. Today, we expect GBP/USD to move within the range bounded by the levels of 1.2705 and 1.2863. The higher linear regression channel is pointing downwards, suggesting a downward trend. The CCI indicator entered the oversold area three times in May, and the British currency started a new phase of growth. However, this correction should have ended a long time ago.
Nearest support levels:
S1 - 1.2726
S2 - 1.2695
S3 - 1.2665
Nearest resistance levels:
R1 - 1.2756
R2 - 1.2787
R3 - 1.2817
Trading Recommendations:
The GBP/USD pair remains upbeat. The pound manages to rise even when it has no reason to do so. And even when it does, the growth turns out to be much stronger than one might expect. However, we still expect downward movement, but with the current paradoxical rise of the British currency, we may have to wait for it for a long time. Short positions remain much more relevant, as most of the factors point downwards. Therefore, you may consider selling the pair with targets at 1.2665 and 1.2604, but only if the price consolidates below the moving average. You may consider longs above the moving average line if you trade solely on technique or if this week's U.S. reports turn out to be disappointing. And two of them have already turned out to be weak.
Explanation of Illustrations:
- Linear Regression Channels – Helps determine the current trend. If both are directed in the same direction, it means the trend is currently strong.
- Moving Average Line (settings 20.0, smoothed) – Determines the short-term trend and the direction in which trading should currently be conducted.
- Murray Levels – Target levels for movements and corrections.
- Volatility Levels (red lines) – The probable price channel in which the pair will spend the next day, based on current volatility indicators.
- CCI Indicator – Its entry into the oversold area (below -250) or the overbought area (above +250) means that a trend reversal in the opposite direction is imminent.


