


To open long positions on GBP/USD:
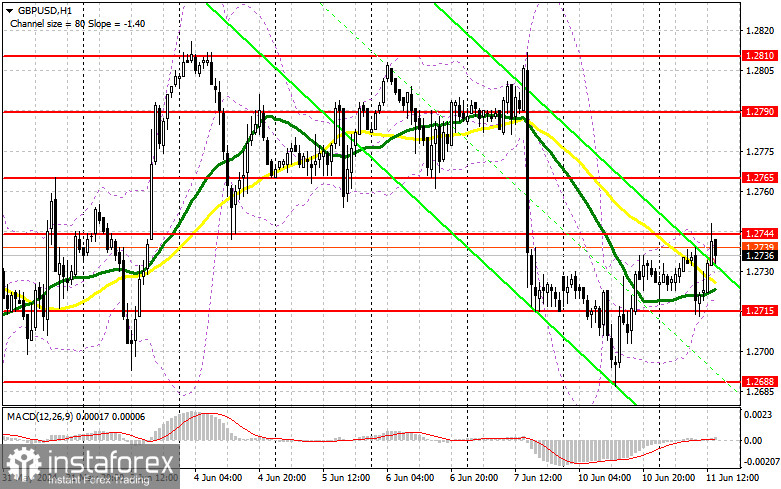
Pound buyers quickly recovered from the morning decline after the release of weak labor market statistics from the UK. The second half of the day could also be in their favor since there are no US statistics ahead that could seriously harm the purchasing power of major players. In case of a decline, I will act only after forming a false breakout around 1.2715, the minimum of today, which will provide an entry point for long positions with a target of returning to the resistance at 1.2744. A breakout and a top-down retest of this range will allow for another setup to buy, opening the way to 1.2765. The furthest target will be the area of 1.2790, where I plan to take profits. If GBP/USD declines again and there is no activity from the bulls at 1.2715 in the second half of the day, the pound risks entering a bearish market stage, increasing pressure on the pair. This would also lead to a decline and update of the next support at 1.2688. Only forming a false breakout will be a suitable condition for opening long positions. I plan to buy GBP/USD immediately on a rebound from the minimum at 1.2646, with a target of a 30-35 point upward correction within the day.
To open short positions on GBP/USD:
Sellers retain all chances of building a bearish market, but they need to prove their presence around the resistance at 1.2744 first, which could be retested after the release of the NFIB Small Business Optimism Index. Forming a false breakout will be the starting point for selling the pound with a target of a decline to 1.2715, where sellers have already faced issues today. A breakout of this range and a retest from bottom to top will deal a blow to the bulls' positions, leading to stop-loss orders being triggered and opening the way to 1.2688. The furthest target will be the area of 1.2646, where I will take profits. If GBP/USD rises in the second half of the day and there is no bearish activity at 1.2744, buyers will keep trading within a broader sideways channel. In this case, I will postpone selling until a false breakout at 1.2765. If there is no downward movement there, I will sell GBP/USD immediately on a rebound from 1.2790, but only aiming for a 30-35 point downward correction within the day.
Indicator Signals:
Moving averages
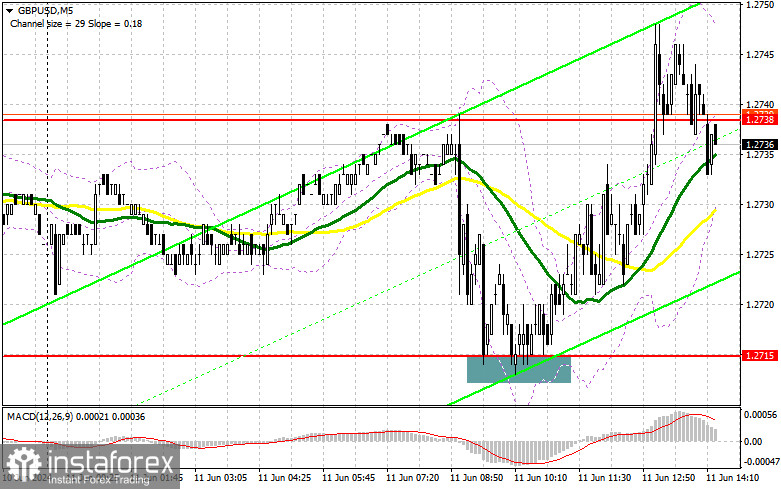
Trading is conducted around the 30 and 50-day moving averages, indicating market uncertainty.
Note: The period and prices of the moving averages are considered by the author on the H1 hourly chart, differing from the classic daily moving averages on the D1 daily chart.
Bollinger Bands
In case of a decline, the lower boundary of the indicator, around 1.2715, will act as support.
Description of indicators:
- Moving average (determines the current trend by smoothing volatility and noise). Period 50. Marked in yellow on the chart.
- Moving average (determines the current trend by smoothing volatility and noise). Period 30. Marked in green on the chart.
- MACD indicator (Moving Average Convergence/Divergence - convergence/divergence of moving averages) Fast EMA period 12. Slow EMA period 26. SMA period 9.
- Bollinger Bands. Period 20.
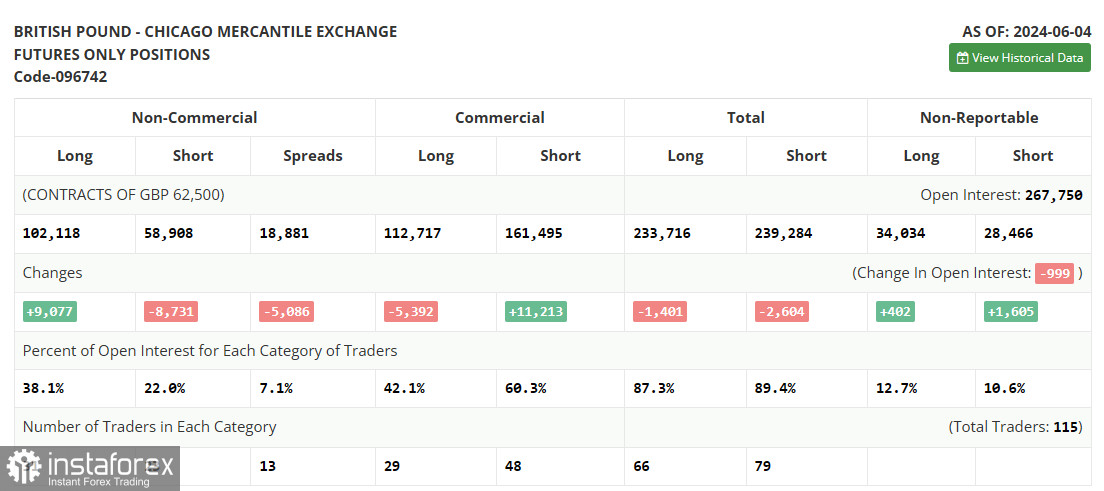
- Non-commercial traders - speculators such as individual traders, hedge funds, and large institutions using the futures market for speculative purposes and meeting certain criteria.
- Long non-commercial positions represent the total long open position of non-commercial traders.
- Short non-commercial positions represent the total short open positions of non-commercial traders.
- The total non-commercial net position is the difference between the short and long positions of non-commercial traders.


