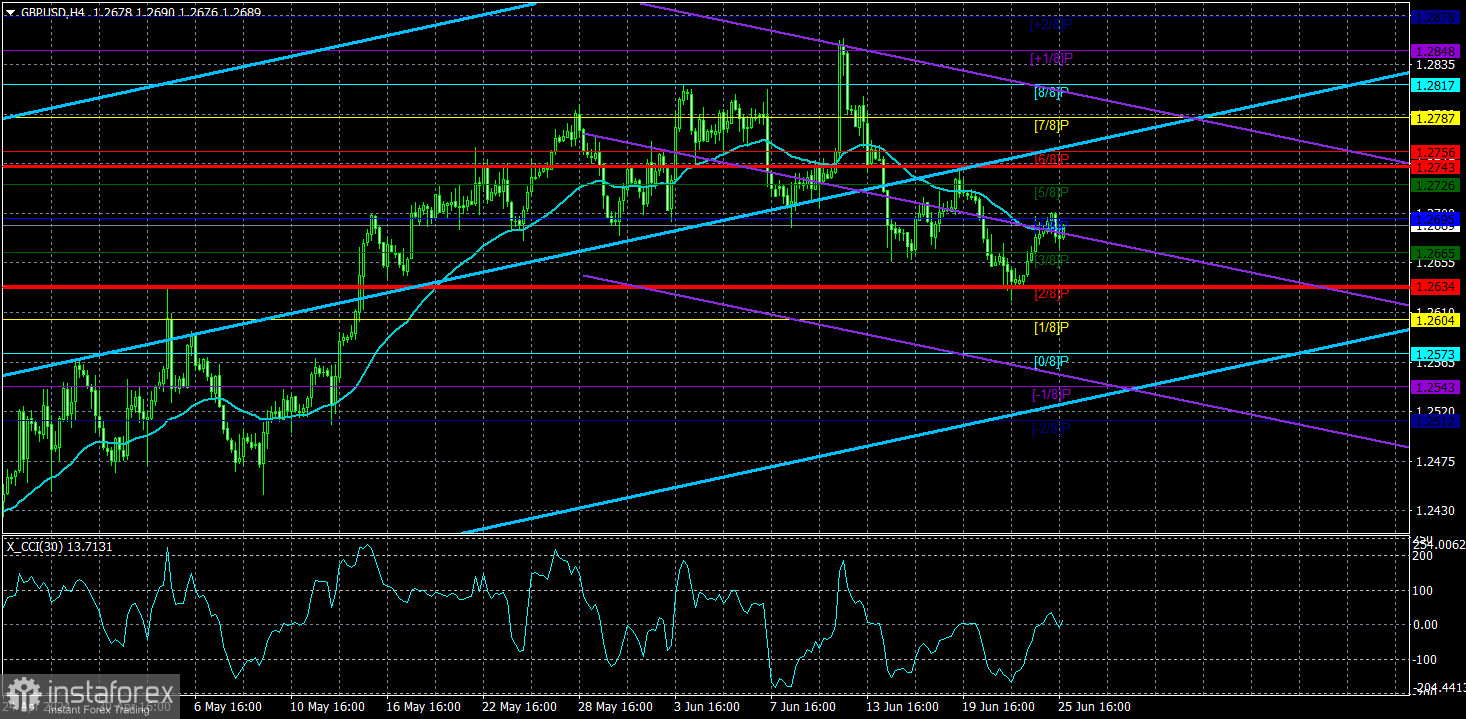
GBP/USD also edged lower on Tuesday, which can be seen as a new attempt to continue the new downtrend on the 4-hour timeframe. Just a quick heads-up, the pound sterling has only slightly depreciated against the dollar since the last local high. Moreover, it retains real prospects to resume the upward trend on the 4-hour timeframe. This is mainly because the market is quite favorable to the British currency, and the Bank of England and major market makers can support its rate. Therefore, we do see the current decline as the start of a new downtrend with a target around the level of 1.2300, but we need to remain cautious. The pound has presented many unpleasant surprises over the past six months.
Since the BoE has decided to not lower its key rate in June, the market may have decided that it is not the time to sell. We are confident that the BoE will start easing monetary policy on August 1. Perhaps the market is waiting for this moment so it can finally start the long-awaited sell-off. It is worth noting that the euro also went through a correction for two months, but after strong Non-Farm Payrolls in the US and the European Central Bank's decision to cut rates, it finally started to fall. Perhaps GBP/USD traders also need a clear and distinct trigger.
The first rate cut in the UK, combined with the uncertainty associated with parliamentary elections, could mount pressure on the British currency. The market dislikes unclear situations and uncertain prospects. It is unclear what will happen after the Labour Party forms a majority in the UK Parliament. But changes will undoubtedly occur, as many are dissatisfied with the Conservative rule. The British public was fed up with Boris Johnson, Liz Truss, and is now ready to vote for anyone but the Conservatives. It is also unclear what will happen to Rishi Sunak after the elections.
Therefore, we believe that the pound should have fallen before, and now even more so. A sideways channel between the levels of 1.23 and 1.28 is clearly visible on the 24-hour timeframe. The price recently hit the upper boundary of the channel for the third time (or maybe even the twenty-third time), so now it could fall by at least 500-600 pips. The global downtrend, which began last year, has not ended. The fundamental background supports the dollar much more than the pound. The US has shown much better economic reports than the UK. The pound sterling is overbought and unreasonably expensive. We believe that this set of bearish factors is enough for the British currency to finally start a firm downtrend. The nearest target could be the level of 1.2600.

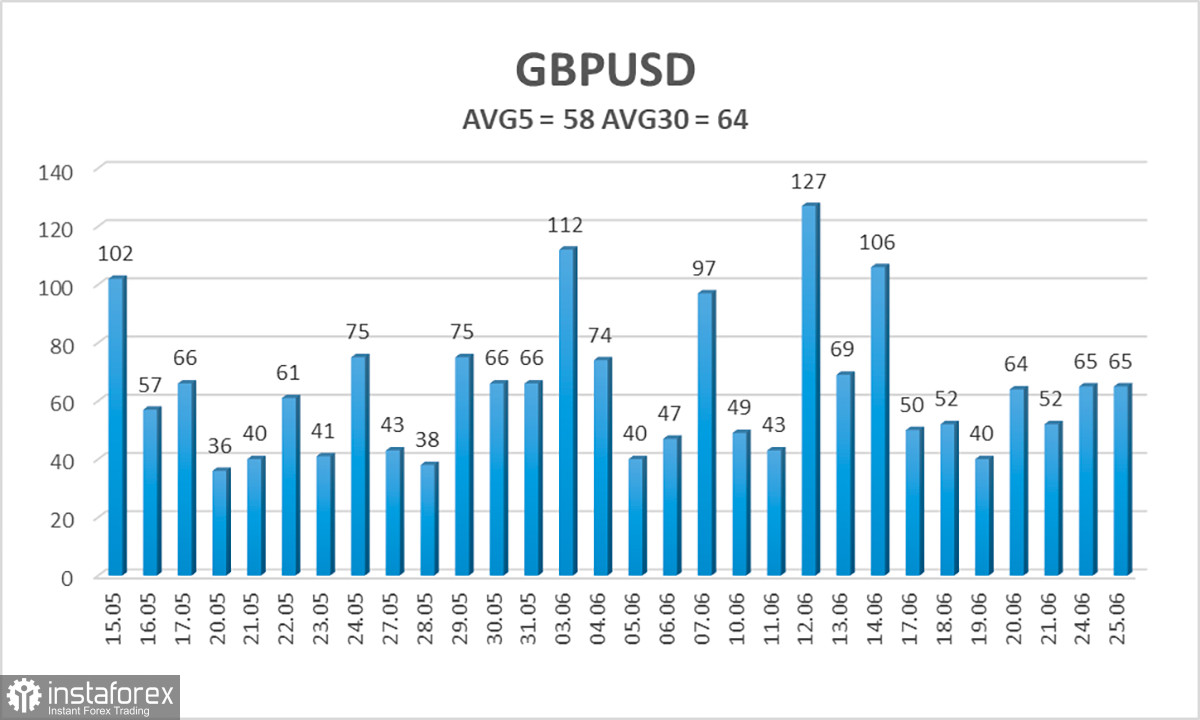
The average volatility of GBP/USD over the last five trading days is 58 pips. This is considered a low value for the pair. Today, we expect GBP/USD to move within a range bounded by the levels of 1.2633 and 1.2743. The higher linear regression channel is pointing upwards, which suggests that the upward trend will continue. The CCI indicator entered the oversold area three times in the month before last, and the British currency started a new phase of growth. However, this correction has presumably ended. There are no new entries into the overbought and oversold areas.
Nearest support levels:
S1 - 1.2665
S2 - 1.2634
S3 - 1.2604
Nearest resistance levels:
R1 - 1.2695
R2 - 1.2726
R3 - 1.2756
Trading Recommendations:
The GBP/USD pair has once again consolidated below the moving average line and is trying to break the upward trend of the previous months. Therefore, after consolidating below the moving average line and overcoming the area of 1.2680-1.2695, the pound has higher chances of falling further. However, traders should be cautious with any positions on the British currency. There is still no reason to buy, and it is risky to sell it, because the market ignored the fundamental and macroeconomic background for two months, and often simply refused to sell the pair. We saw a vivid confirmation of this last week, when the market simply ignored the inflation report and the BoE meeting. Nevertheless, only short positions are valid, if we are talking about a logical and consistent movement.
Explanation of Illustrations:
- Linear Regression Channels – Helps determine the current trend. If both are directed in the same direction, it means the trend is currently strong.
- Moving Average Line (settings 20.0, smoothed) – Determines the short-term trend and the direction in which trading should currently be conducted.
- Murray Levels – Target levels for movements and corrections.
- Volatility Levels (red lines) – The probable price channel in which the pair will spend the next day, based on current volatility indicators.
- CCI Indicator – Its entry into the oversold area (below -250) or the overbought area (above +250) means that a trend reversal in the opposite direction is imminent.


