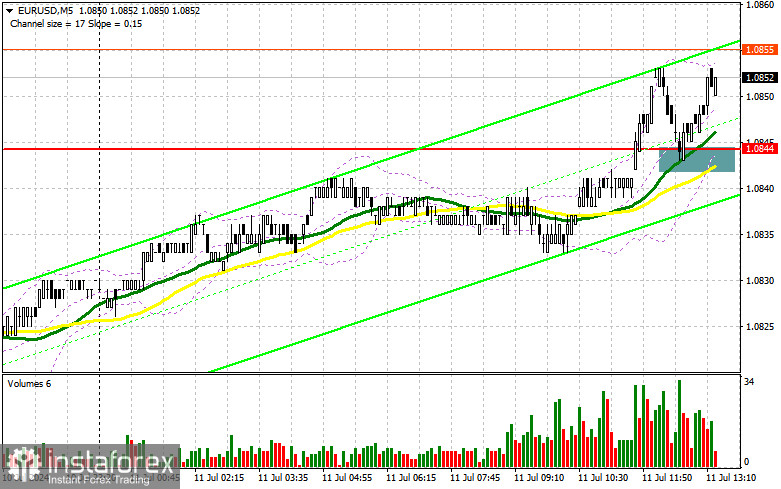
In my morning forecast, I focused on the 1.0844 level and planned to make market entry decisions based on it. Let's look at the 5-minute chart and analyze what happened there. The breakout and subsequent retest of 1.0844 provided a buying opportunity for the euro. However, as you can see on the chart, the bullish market did not develop as expected in the absence of significant statistics. The technical outlook for the second half of the day remains unchanged.

To Open Long Positions on EUR/USD:
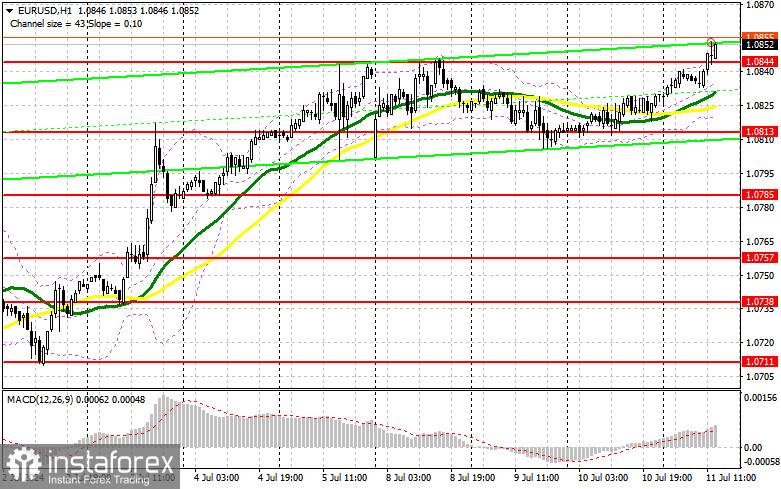
The most important event for the second half of the day will be the US Consumer Price Index data. It is particularly important to observe how the core Consumer Price Index, which excludes food and energy prices, changes. Weekly initial jobless claims and the speech by FOMC member Raphael Bostic will be secondary. If inflation rises, the market will turn on its head, leading to a drop in the euro and a strengthening of the dollar, which I plan to capitalize on. If the data indicates a decline in US inflation, the euro can develop the bullish market further. In case of a decline, I plan to act around the nearest support level at 1.0813, where the pair could quickly fall. This will provide a suitable entry point for long positions targeting a recovery to 1.0844, a highly contested level. A breakout and retest of this range from above will strengthen the pair with a chance to rise to the resistance at 1.0871. The ultimate target will be the 1.0899 high, where I will take profit. Testing this level will allow the bullish trend to continue. If EUR/USD declines and there is no activity around 1.0813 in the second half of the day, with the moving averages slightly above this level supporting the bulls, I will only enter after forming a false breakout at the next support at 1.0785. I plan to open long positions immediately on a bounce from the 1.0757 low, aiming for an intraday upward correction of 30-35 points.
To Open Short Positions on EUR/USD:
Sellers are no longer trying to oppose buyers, relying entirely on US inflation data. Only this "lifeline" can lead to a substantial correction in the pair. If EUR/USD continues to rise, which is more likely since everything points to a decrease in US inflation, only a false breakout around the new resistance at 1.0871 will provide a suitable entry point for short positions, aiming for a fall to support at 1.0844, with the moving averages slightly below this level supporting the bulls. A breakout and consolidation below this range, followed by a retest from below, will pressure the euro again and offer another selling point, targeting the 1.0813 low, where I expect more active buying of the euro. The ultimate target will be the 1.0785 area, where I will take profit. If EUR/USD rises in the second half of the day and there are no bears at 1.0871, buyers will achieve further growth in the pair. In this case, I will postpone sales until testing the next resistance at 1.0899. I will also sell there, but only after an unsuccessful consolidation. I plan to open short positions immediately on a rebound from 1.0942, targeting a downward correction of 30-35 points.


Indicator Signals:
Moving averages:
Trading is conducted above the 30 and 50-day moving averages, indicating further euro growth.
Note: The author considers the period and prices of the moving averages on the hourly H1 chart and differs from the general definition of classical daily moving averages on the daily D1 chart.
Bollinger Bands:
In case of a decline, the lower boundary of the indicator, around 1.0815, will act as support.
Description of Indicators:
- Moving average: Defines the current trend by smoothing volatility and noise. Period 50. Marked in yellow on the chart.
- Moving average: Defines the current trend by smoothing volatility and noise. Period 30. Marked in green on the chart.
- MACD Indicator (Moving Average Convergence/Divergence): Fast EMA period 12. Slow EMA period 26. SMA period 9
- Bollinger Bands: Period 20
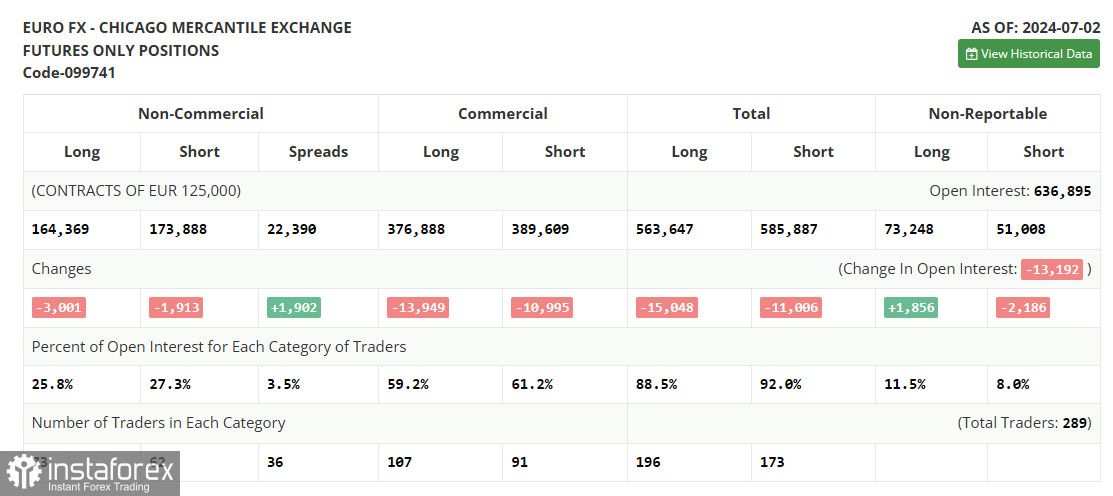
- Non-commercial traders: Speculators such as individual traders, hedge funds, and large institutions use the futures market for speculative purposes and meet certain requirements.
- Long non-commercial positions: The total long open positions of non-commercial traders.
- Short non-commercial positions: The total short open positions of non-commercial traders.
- Total non-commercial net position: The difference between non-commercial traders' short and long positions.


