Analysis of EUR/USD 5M

EUR/USD entered a bearish correction within the upward trend that has been observed for three weeks. Throughout this period, we have repeatedly mentioned that the dollar had valid reasons to fall, mainly related to weak U.S. macro data. However, the market frequently bought the pair without any reasons or grounds, and the few strong data points from the U.S. did not trigger any significant growth for the dollar. Thus, the first conclusion is that the euro's current rise is not entirely logical.
Yesterday, the European Central Bank left all three key rates unchanged, and ECB President Christine Lagarde said that "what we do in September is wide open". Lagarde mentioned that inflation remains high, and wages are still rising at an elevated rate. Based on this, not all members of the ECB's monetary committee support a rate cut at the next meeting. Lagarde also mentioned that decisions would be made on a meeting-by-meeting basis, based on all incoming information. In general, Lagarde cast doubt on a rate cut in September, which should have triggered the euro's rise. However, the pair fell... The decline is not strong, it does not break the upward trend, but it confirms how illogical the current movements are.
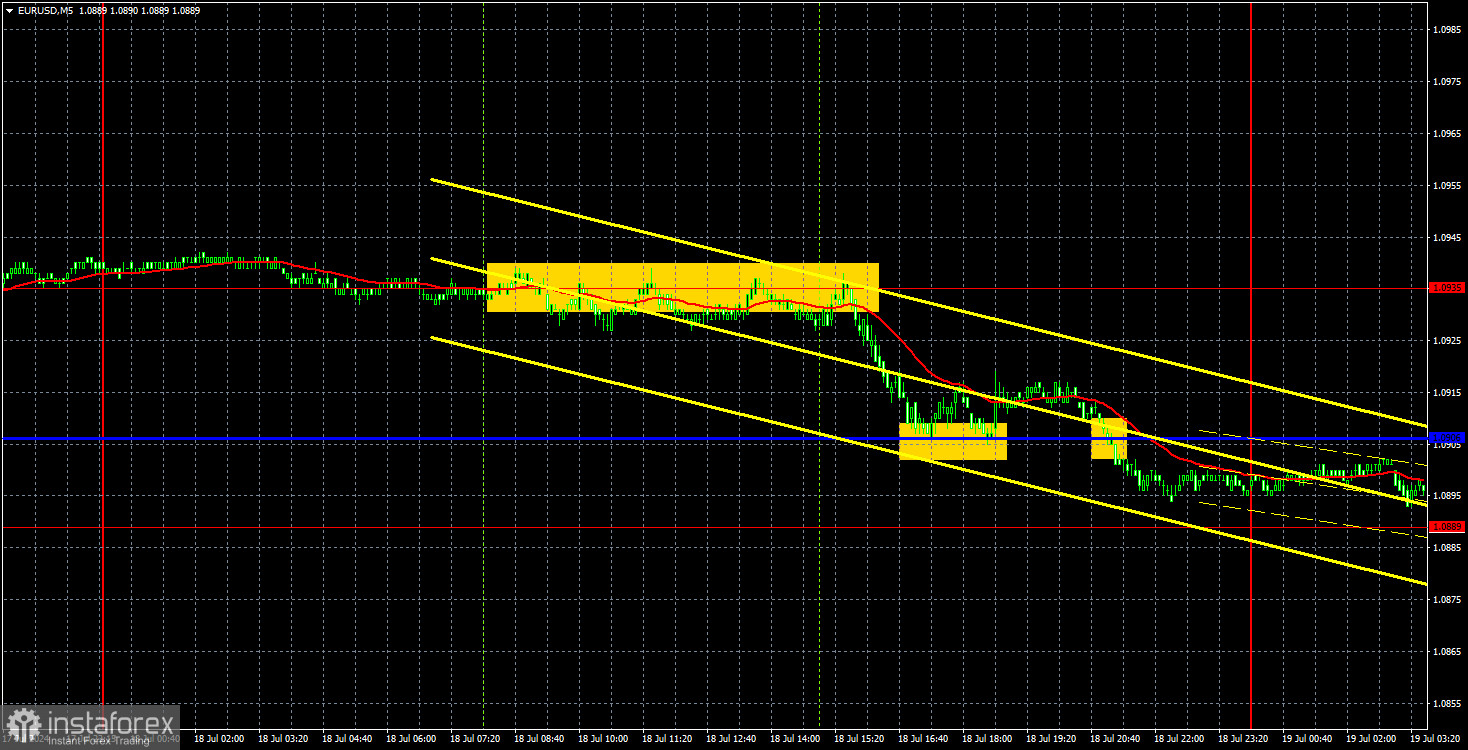
Volatility was very weak on Thursday, and the pair only formed one trading signal. Throughout the European session, the price tried its best to bounce off the 1.0935 level, and at the beginning of the U.S. session, it managed to do so. Therefore, traders could open short positions. Within an hour, the price reached the Kijun-sen line, where short positions could be closed. Now, for further sales, a consolidation below the 1.0889 level can be used. We believe that under current circumstances, it is not certain whether the euro will fall further.
COT report:

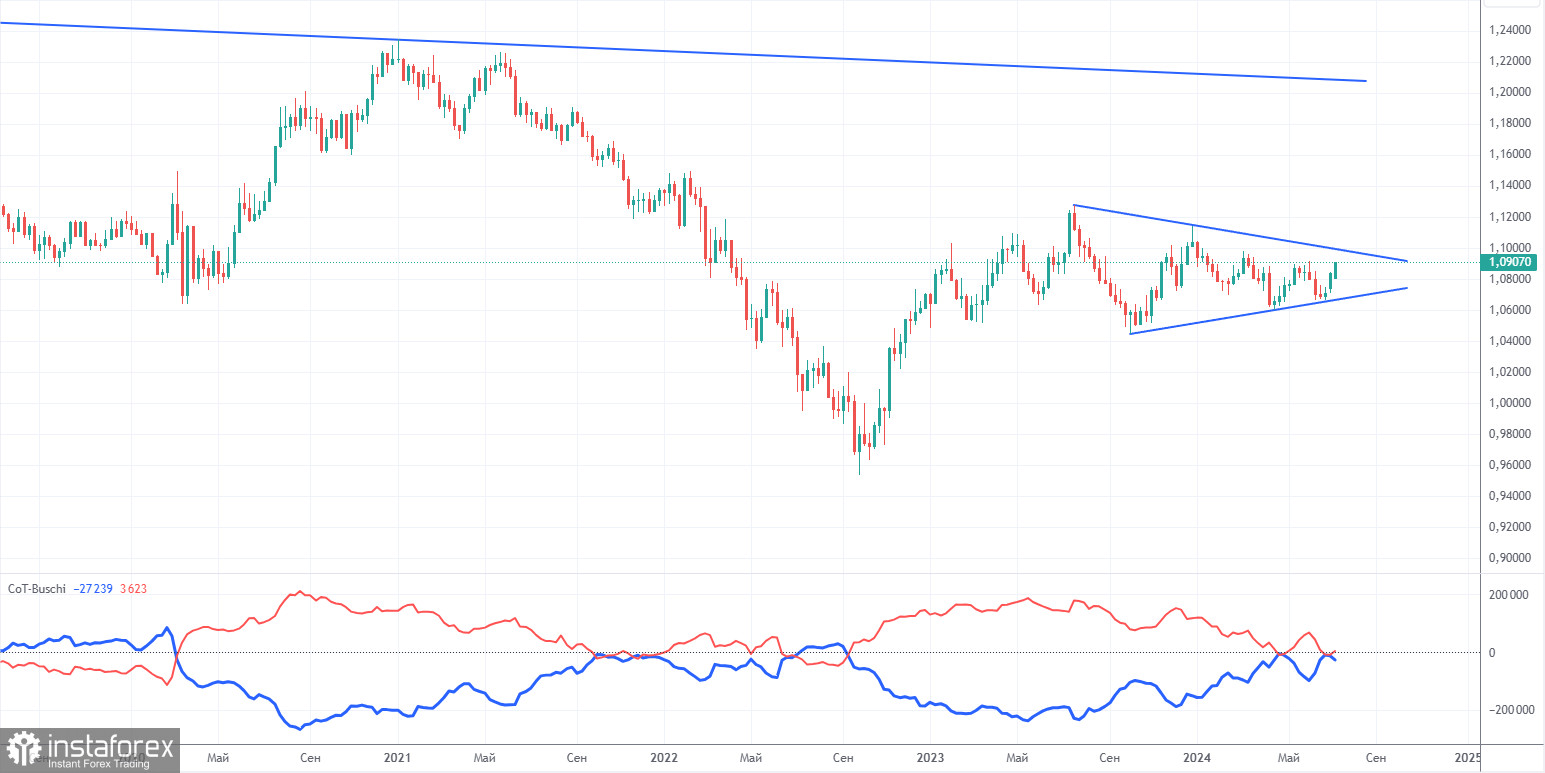
The latest COT report is dated July 9. The net position of non-commercial traders has remained bullish for a long time. The bears' attempt to gain dominance failed miserably. The net position of non-commercial traders (red line) has been declining in recent months, while that of commercial traders (blue line) has been growing. Currently, they are approximately equal, indicating the bears' new attempt to seize the initiative.
We don't see any fundamental factors that can support the euro's strength, while technical analysis also suggests that the price is in the consolidation zone – in a triangle. Now the pair's movement will depend on which border the price leaves.
Currently, the red and blue lines are approaching each other, which indicates a build-up in short positions on the euro. During the last reporting week, the number of long positions for the non-commercial group decreased by 1,500, while the number of short positions decreased by 11,600. As a result, the net position increased by 13,100. According to the COT reports, the euro still has significant potential for a decline.
Analysis of EUR/USD 1H

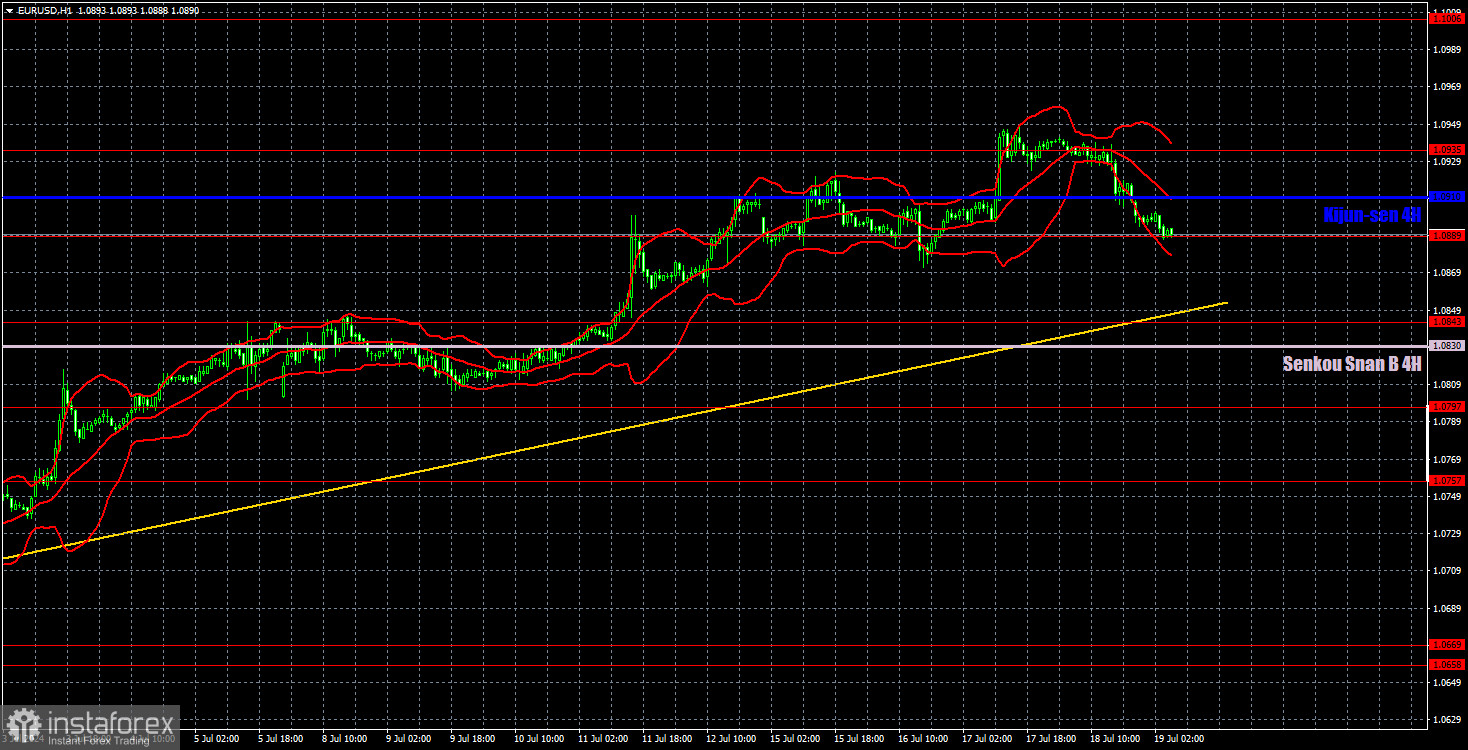
On the 1-hour chart, EUR/USD continues to form a new uptrend. We currently have an ascending trend line, above which the upward trend remains intact. All the economic reports from the past three weeks had a devastating impact on the dollar, even when the data favored the dollar. Meanwhile, the global downtrend persists on the 24-hour timeframe, which means that the pair could still fall back to the 1.06 level.
On July 19, we highlight the following levels for trading: 1.0530, 1.0581, 1.0658-1.0669, 1.0757, 1.0797, 1.0843, 1.0889, 1.0935, 1.1006, 1.1092, as well as the Senkou Span B (1.0805) and Kijun-sen (1.0906) lines. The Ichimoku indicator lines can move during the day, so this should be taken into account when identifying trading signals. Don't forget to set a Stop Loss to breakeven if the price has moved in the intended direction by 15 pips. This will protect you against potential losses if the signal turns out to be false.
On Friday, no significant events are scheduled in the Eurozone or the United States. Therefore, the pair may go through low volatility today, and the euro may continue to slowly drift downwards. We still believe that a decline is the most logical scenario for the currency pair. On the 24-hour timeframe, the pair bounced off the important level of 1.0940 (50.0% Fibonacci). The price is also at the upper boundary of the horizontal channel on the same intraday timeframe.
Description of the chart:
Support and resistance levels are thick red lines near which the trend may end. They do not provide trading signals;
The Kijun-sen and Senkou Span B lines are the lines of the Ichimoku indicator, plotted to the 1H timeframe from the 4H one. They provide trading signals;
Extreme levels are thin red lines from which the price bounced earlier. They provide trading signals;
Yellow lines are trend lines, trend channels, and any other technical patterns;
Indicator 1 on the COT charts is the net position size for each category of traders;


