


Trend Analysis (Fig. 1)
On Friday, GBP/USD may continue to fall from the level of 1.2940 (yesterday's daily candle close), as it aims for 1.2923 – the 8 EMA (thin blue line). Upon testing this line, the price may start rising with the target of 1.2980 – the 14.6% retracement level (red dashed line).
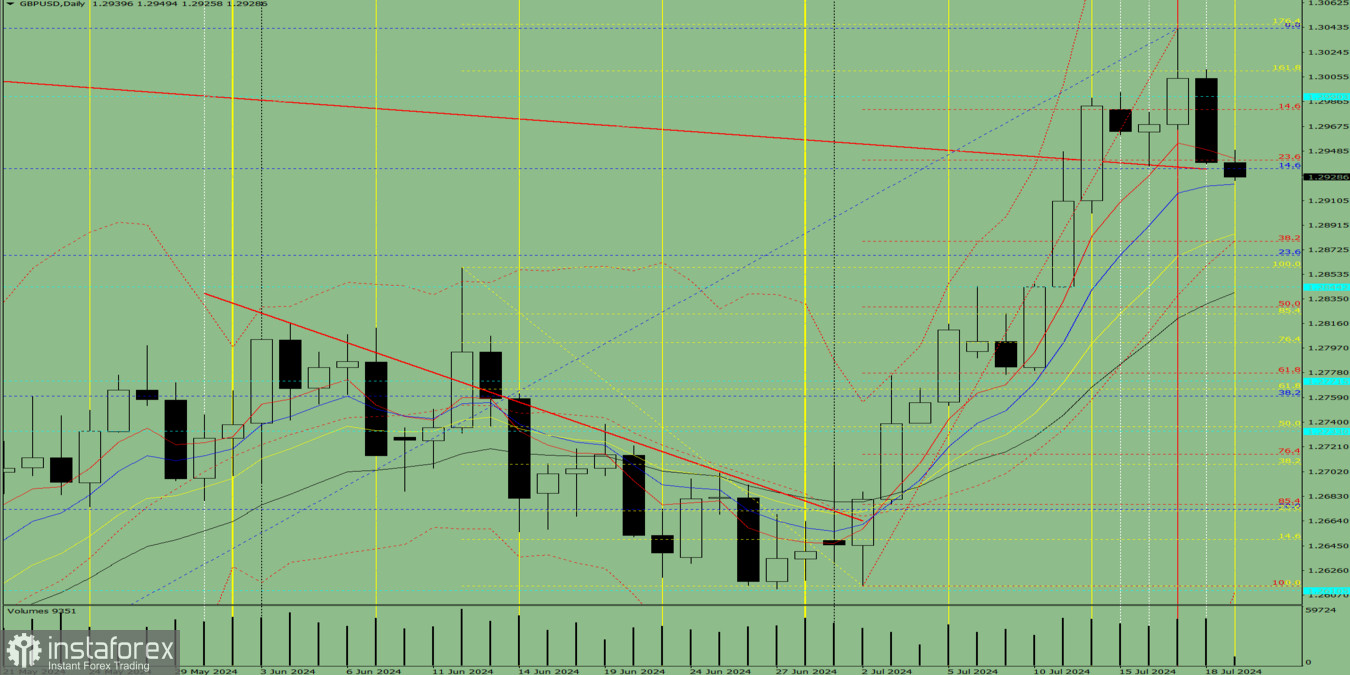
Fig. 1 (daily chart)
Comprehensive Analysis:
- Indicator Analysis – down;
- Fibonacci Levels – down;
- Volumes – down;
- Candlestick Analysis – down;
- Trend Analysis – up;
- Bollinger Bands – up;
- Weekly Chart – up.
General Conclusion:
Today, the price may continue to fall from the level of 1.2940 (yesterday's daily candle close), as it aims for 1.2923 – the 8 EMA (thin blue line). Upon testing this line, the price may start rising with the target of 1.2980 – the 14.6% retracement level (red dashed line).
Alternative Scenario: GBP/USD may continue to fall from the level of 1.2940 (yesterday's daily candle close), as it aims for 1.2885 – the 13 EMA (thin yellow line). Upon testing this line, the price may start rising with the target of 1.2980 – the 14.6% retracement level (red dashed line).


