


Details of economic calendar on July 18
On Thursday, all investors' attention was focused on the meeting of the European Central Bank at which the regulator, as expected, kept key interest rates at the same level. This decision coincided with the expectations of analysts and market participants. The ECB press release noted that most economic indicators were either stable or declined in June. The ECB also underscored that the financing conditions remain restrictive. At the same time, inflation in the euro area remains high, service inflation is likely to persist in the medium term. Headline inflation is expected to be above the ECB 2% target both this year and next.

Overview of technical charts on July 18
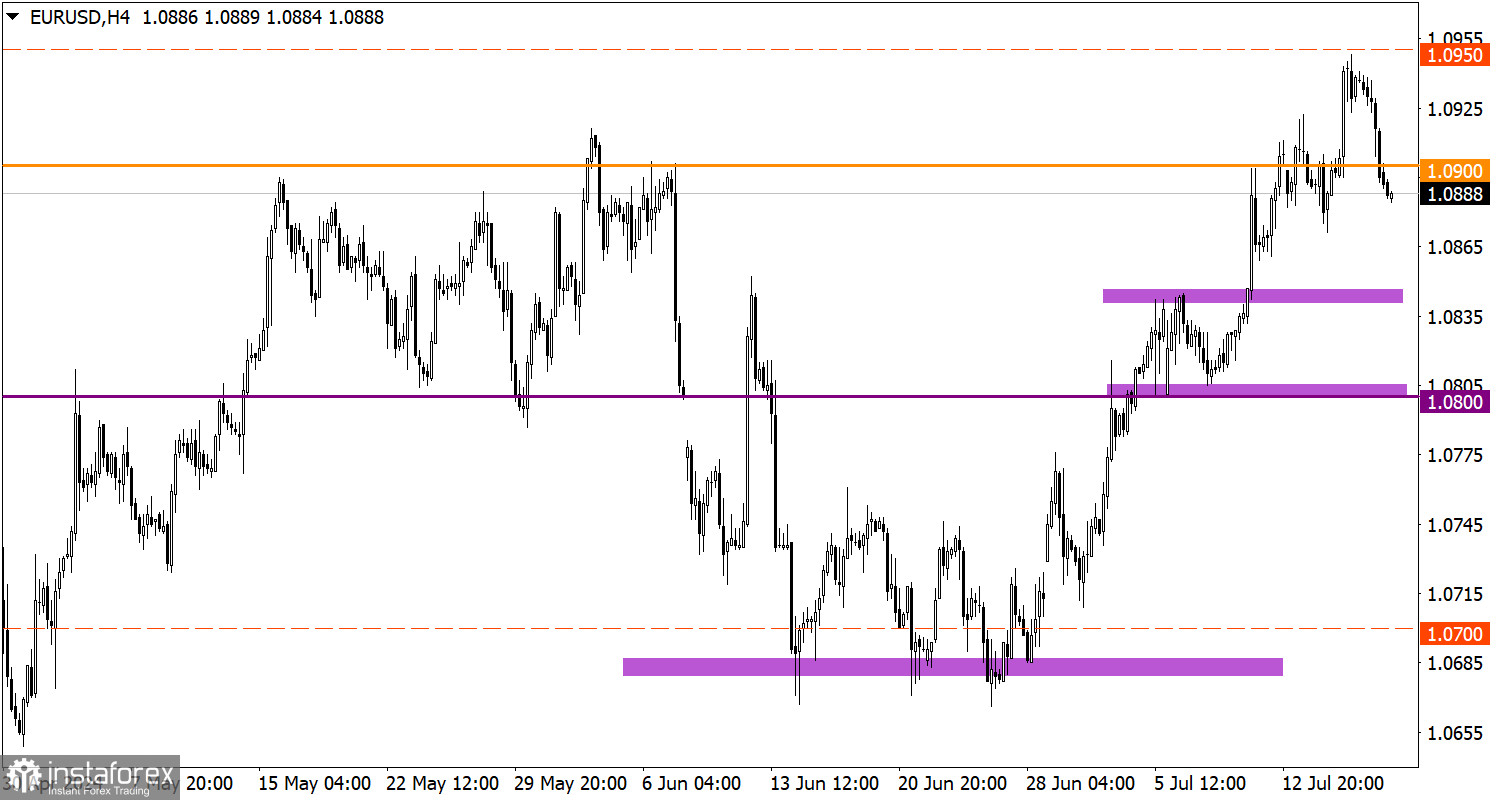
Traders cut on long positions on the EUR/USD pair within the lower border of the corridor between 1.0950 and 1.1000. As a result, the price pulled back which led to a decline below 1.0900.
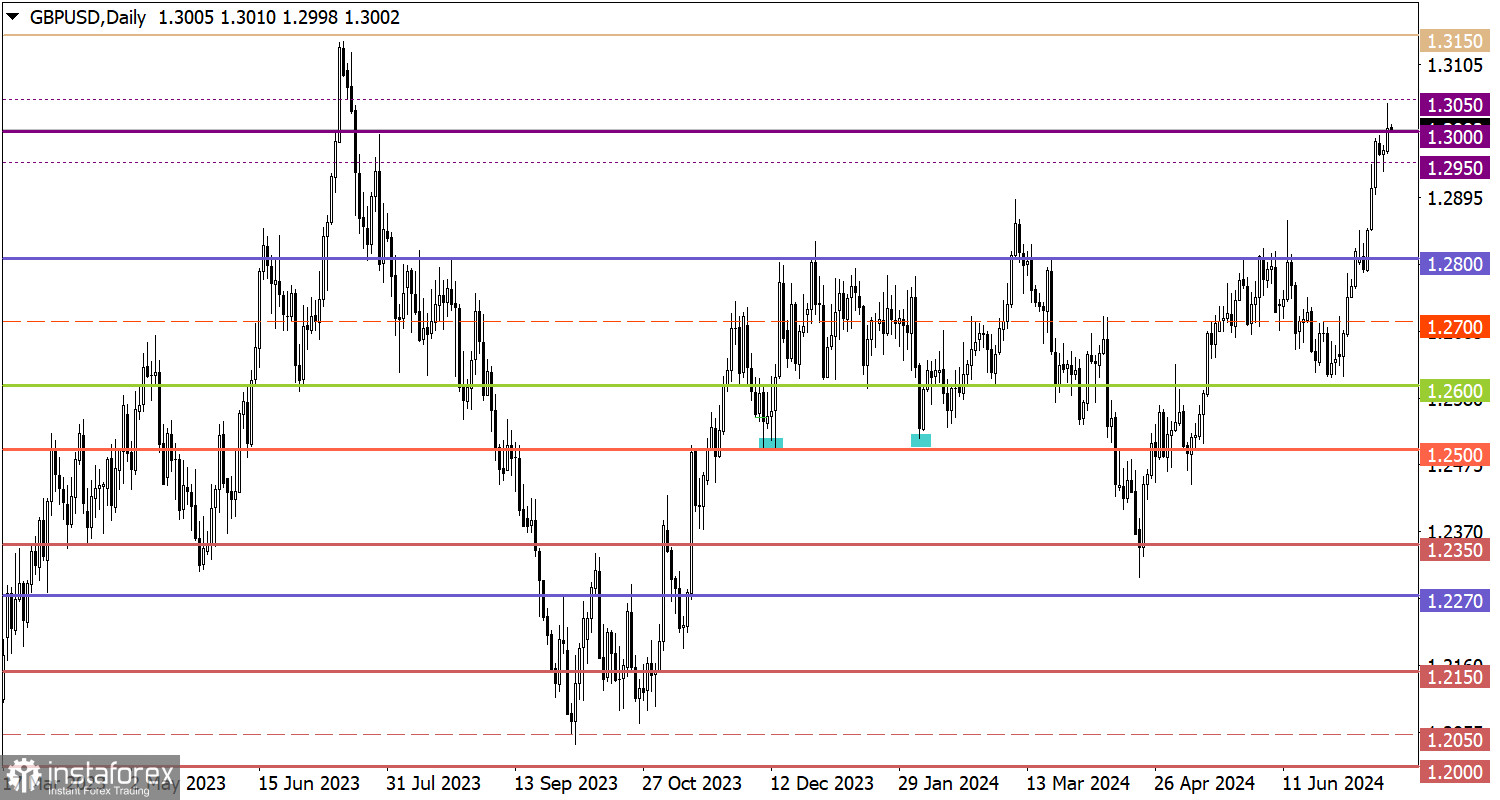
The GBP/USD pair also saw a reduction in the volume of long positions when the price touched the psychological level of 1.3000. As a result, the instrument had a pullback, as a result of which the price dropped below 1.2950.
Economic calendar on July 19
During the early European session today, data on retail sales in the UK was published. The retail sales volume shrank by 1.2% in June after growing by 2.9% in May. The reading is worse than forecasts for a fall of 0.4%.
Trading plan for EUR/USD on July 19
If EUR/USD settles below 1.0900 by the end of the week, the instrument may continue the current pullback. Otherwise, a local weakening of the euro could attract buyers, leading to a new bullish stage.
Trading plan for GBP/USD on July 19
The ongoing pullback could intensify if the price settles below 1.2950 by the end of the week. However, if the price rebounds above this level, we expect GBP/USD to oscillate in the corridor of 1.2950 to 1.3050.
What's on charts
The candlestick chart type consists of graphic rectangles in white and black with lines at the top and bottom. With a detailed analysis of each individual candle, you can see its characteristics relative to a particular time period: opening price, closing price, maximum and minimum price.
Horizontal levels are price coordinates relative to which a price may stop or revered its trajectory. In the market, these levels are called support and resistance.
Circles and rectangles are highlighted examples where the price developed. This color highlighting indicates horizontal lines that may put pressure on the price in the future.
Up/down arrows are guidelines for a possible future trajectory.


