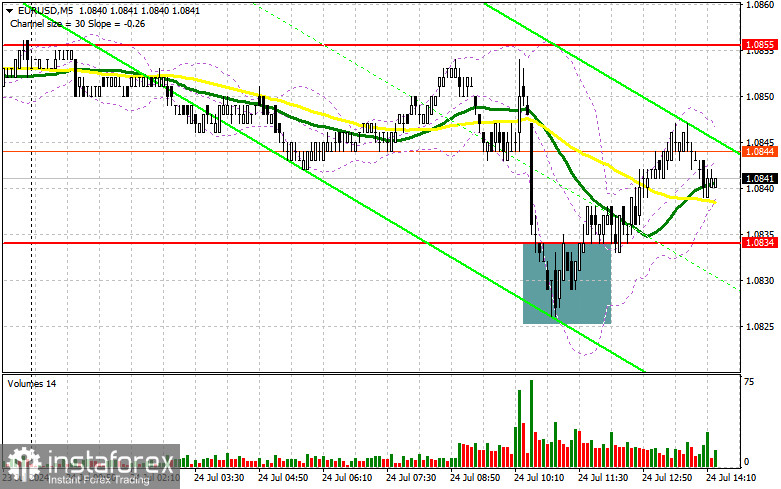
I focused on the 1.0834 level in my morning forecast and planned market entry decisions based on this level. Let's examine the 5-minute chart to understand the developments. A decline and the formation of a false breakout provided a buying opportunity for the euro; however, at the time of writing, the movement had been only about 12 points. The technical outlook was revised for the second half of the day.

For Opening Long Positions on EURUSD:
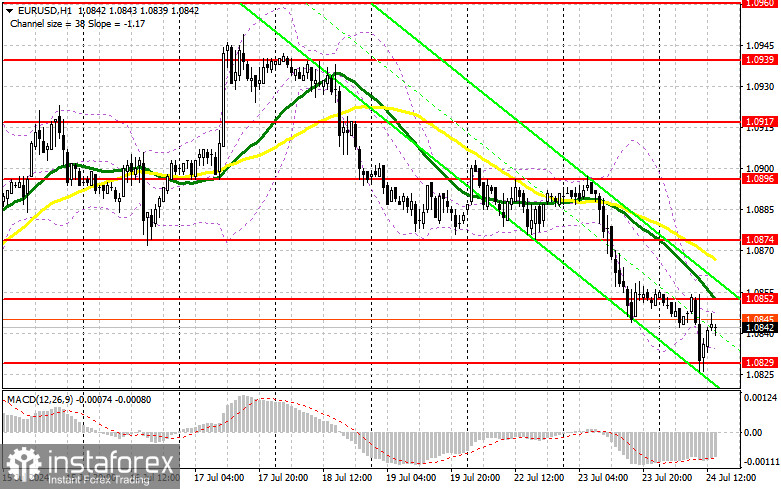
The euro declined further in response to weak PMI indices, particularly in manufacturing activity, which began to contract more significantly across many Eurozone countries. However, similar statistics from the US are upcoming. In addition to the manufacturing PMI, services PMI, and composite PMI, attention should be given to new home sales volumes and the trade balance of goods. Yesterday's disappointing housing market data did not significantly impact the dollar, giving bears a strong opportunity to push the pair even lower. In this scenario, I prefer to act after a false breakout near the new support level at 1.0829, which formed during the first half of the day. This would provide an excellent entry point for buying, targeting a correction towards 1.0852, where the moving averages are positioned against the buyers. A breakout and renewed upward movement within this range would strengthen the pair, potentially rising towards 1.0874. The farthest target will be the 1.0896 maximum, where I will take profits. If EUR/USD declines and there is a lack of activity around 1.0829 in the second half of the day, sellers will continue their activities, targeting further declines in the euro. I will enter only after a false breakout near the next support at 1.0808. I plan to open long positions immediately following a rebound from 1.0785, targeting an upward correction of 30-35 points within the day.
For Opening Short Positions on EURUSD:
Sellers continue to act more actively, and strong US statistics should support this trend. It is best to act on a rise after a false breakout around the new resistance at 1.0852, where the moving averages are positioned, favoring bears. This would be an ideal scenario for entering short positions to continue the downward trend towards support at 1.0829. A breakout and securing a position below this range, followed by a reverse test from bottom to top, will increase pressure on the euro and provide another selling point towards the minimum of 1.0808, where I expect to see more active euro buyers. The farthest target will be the 1.0785 area, where I will take profits. Testing this level will suggest a bearish market setup. If EUR/USD moves up in the second half of the day and bears are absent at 1.0852, which is quite likely, buyers may regain the initiative. In this case, I will postpone selling until the next resistance at 1.0874. I will consider selling there but only after a failed breakout. I plan to open short positions immediately following a rebound from 1.0896, targeting a downward correction of 30-35 points.

The Commitment of Traders (COT) Report:
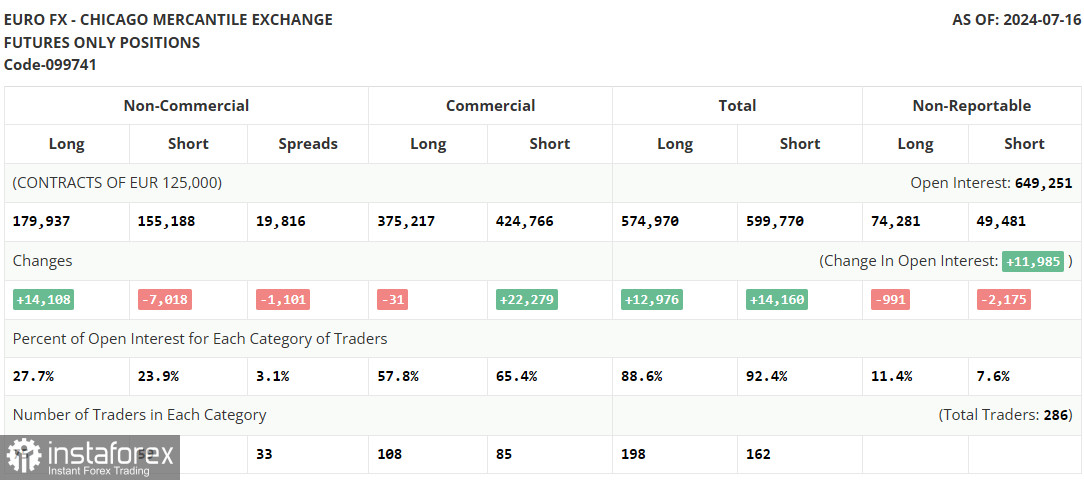
The Commitment of Traders (COT) report for July 16th observed a decrease in short positions and an increase in long positions. Discussions about US interest rate cuts and a planned pause by the European Central Bank obviously fueled demand for risky assets, including the euro, supporting market growth. However, after all the critical data was published and decisions were made—regarding the ECB meeting and maintaining rates unchanged—the market has calmed down, which may continue until the end of this month. Only GDP data will likely lead to volatility spikes. Therefore, it is best to stick to cautious trading within the channel. The COT report indicated that long non-commercial positions increased by 14,108 to 179,937, while short non-commercial positions fell by 7,018 to 155,188. As a result, the spread between long and short positions narrowed by 1,101.

Indicator Signals:
Moving Averages: Trading is below the 30 and 50-day moving averages, indicating a decline in the euro. Note: The period and prices of the moving averages are considered by the author on the hourly H1 chart and differ from the classical daily moving averages on the daily D1 chart.
Bollinger Bands: In case of a decline, the lower boundary of the indicator around 1.0835 will act as support.
Description of Indicators:
- Moving Average: Determines the current trend by smoothing volatility and noise. Period 50. Marked in yellow on the chart.
- Moving Average: Determines the current trend by smoothing volatility and noise. Period 30. Marked in green on the chart.
- MACD Indicator (Moving Average Convergence/Divergence): Fast EMA period 12. Slow EMA period 26. SMA period 9.
- Bollinger Bands: Period 20.
- Non-commercial Traders: Speculators such as individual traders, hedge funds, and large institutions that use the futures market for speculative purposes and meet certain requirements.
- Long Non-commercial Positions: Represent the total long open position of non-commercial traders.
- Short Non-commercial Positions: Represent the total short open position of non-commercial traders.
- Total Non-commercial Net Position: The difference between short and long positions of non-commercial traders.


