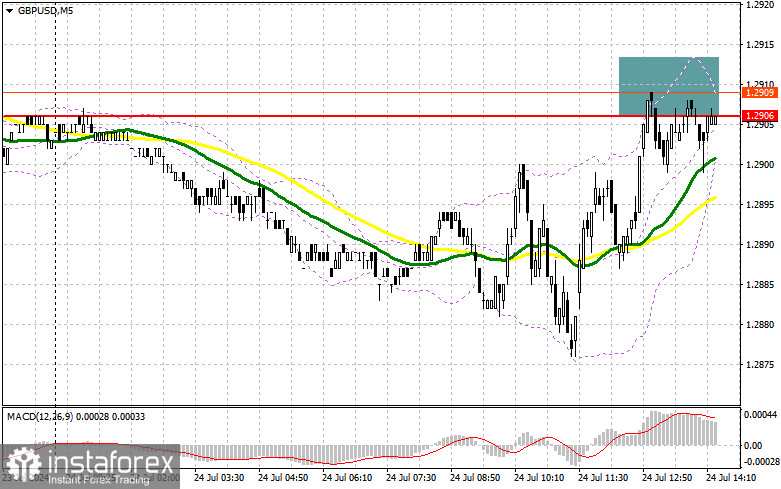
In my morning forecast, I focused on the level of 1.2906 and planned to make market entry decisions from there. Let's examine the 5-minute chart to see what happened. A rise and the formation of a false breakout led to a sell signal for the pound, but as you can see from the chart, a major sell-off has not yet occurred. The technical picture was slightly revised for the second half of the day.

For Opening Long Positions on GBP/USD:
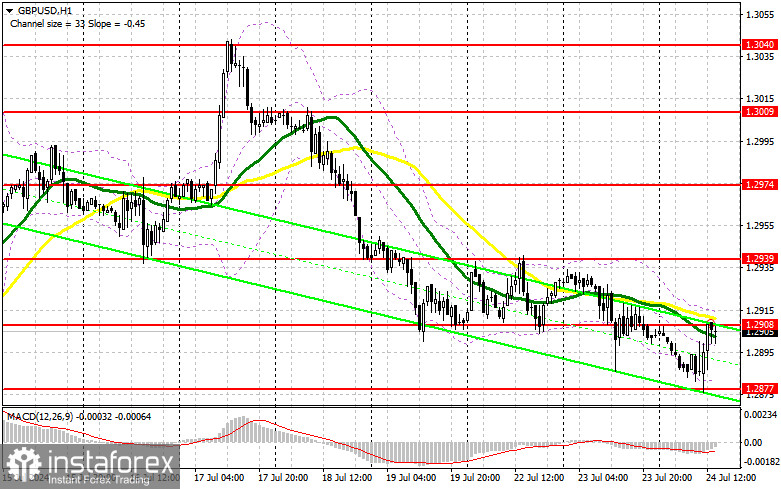
Fairly good statistics from the UK, indicating growth in activity in the services and manufacturing sectors, allowed the pound to return to the daily high, maintaining a high chance for buyers to regain the initiative. We have US statistics in manufacturing PMI, services PMI, and composite PMI. Weak data will help the pound grow even more. Additionally, pay attention to the volume of new home sales in the US and the goods trade balance. In the event of a decline in the pair, only a false breakout at the new support level of 1.2877, formed by the end of today, will provide an entry point for long positions with a target of updating the intermediate resistance at 1.2908, where the moving averages are located, acting on the sellers' side. A breakout and a retest from top to bottom of this range will restore the bullish potential of the pound, leading to an entry point for long positions with a potential test of 1.2939. The furthest target will be the 1.2974 area, where I will take profits. If GBP/USD declines further and there is a lack of activity from the bulls at 1.2877 in the second half of the day, the pound will continue to fall. This will also lead to a decline and a test of the next support at 1.2842, marking the end of the recent bullish market. A false breakout at this level will be a suitable condition for opening long positions. I plan to buy GBP/USD immediately on a rebound from the 1.2806 minimum, with a target of an upward correction of 30-35 points within the day.
For Opening Short Positions on GBP/USD:
Sellers have shown themselves, but good data has nullified all attempts to continue the pound's decline. Only strong US data and defense of 1.2908 will create ideal conditions for opening short positions with the prospect of a decline to the new support at 1.2877. A breakout and a retest from the bottom to the top of this range will hit buyers' positions, triggering stop orders and opening the way to 1.2842. The furthest target will be the 1.2806 area, where I will take profits. Testing this level will end the struggle between buyers and sellers. In the case of GBP/USD growth and a lack of activity at 1.2908 in the second half of the day, buyers will have a chance to rise. In this case, I will postpone sales until a false breakout at 1.2939. Without a downward movement, I will sell GBP/USD immediately on a rebound from 1.2974, but I expect only a downward correction of 30-35 points.

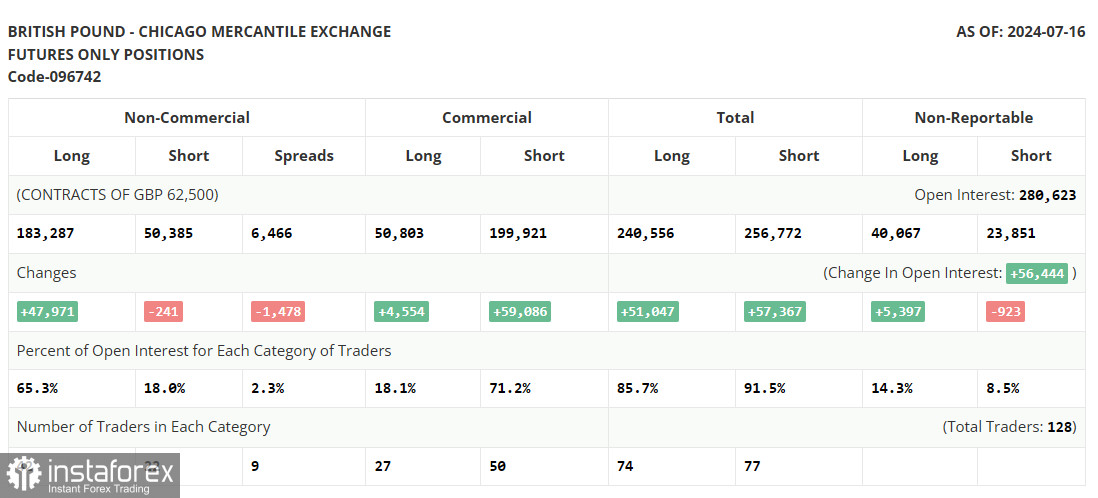
The Commitment of Traders (COT) report for July 16th showed an increase in long positions and a decrease in short positions. The Bank of England's decision to keep rates unchanged allowed the pound to rise significantly—especially against the backdrop of expectations of interest rate cuts in the US. A change in political power also contributed to some growth in GBP/USD. However, the market is experiencing a period of calm, which may lead to the pair lingering in a sideways channel at best, or we may see a further technical correction. The lower the pound, the more attractive it will become for purchases. The latest COT report indicates that long non-commercial positions increased by 47,971 to 183,287, while short non-commercial positions fell by 241 to 50,385. As a result, the spread between long and short positions narrowed by 1,478.

Indicator Signals:
Moving Averages:
Trading is below the 30 and 50-day moving averages, indicating a potential continuation of the pair's decline.
Note: The author considers the period and prices of the moving averages on the hourly H1 chart, which differ from the classical daily moving averages on the daily D1 chart.
Bollinger Bands:
In case of a decline, the lower boundary of the indicator, around 1.2885, will act as support.
Description of Indicators:
- Moving Average: Determines the current trend by smoothing volatility and noise. Period 50. Marked in yellow on the chart.
- Moving Average: Determines the current trend by smoothing volatility and noise. Period 30. Marked in green on the chart.
- MACD Indicator (Moving Average Convergence/Divergence): Fast EMA period 12. Slow EMA period 26. SMA period 9.
- Bollinger Bands: Period 20.
- Non-commercial traders: Speculators such as individual traders, hedge funds, and large institutions that use the futures market for speculative purposes and meet certain requirements.
- Long non-commercial positions: Represent the total long open position of non-commercial traders.
- Short non-commercial positions: Represent the total short open position of non-commercial traders.
- Total non-commercial net position: The difference between short and long positions of non-commercial traders.


