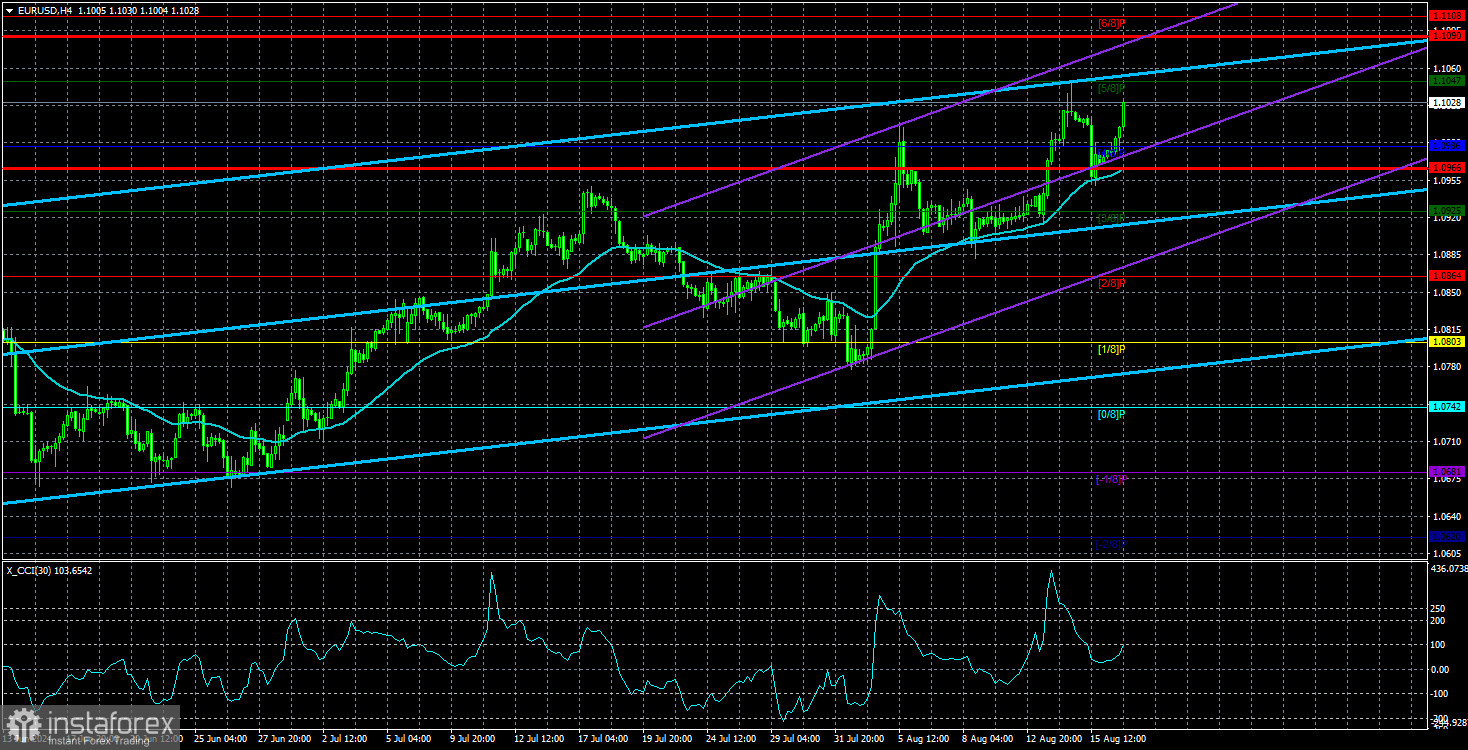
The EUR/USD pair calmly sustained its upward movement on Friday, which was again not based on macroeconomic or fundamental factors. On Friday, there were no significant reports or events in the Eurozone; nonetheless, the euro rose during the night, in the morning, throughout the day, and into the evening. On Thursday, the CCI indicator entered the overbought zone for the third consecutive time. Therefore, we can assume that the pair's upward movement is nearing its end.
It is worth noting that the CCI indicator entering the overbought or oversold zone alone does not mean that the corresponding movement is over. In an uptrend, long positions should be based on entries into the oversold zone. The overbought zone merely confirms the strength of the uptrend. Consequently, theoretically, three entries into the overbought zone do not necessarily mean that the euro's growth will end soon. However, based on experience, we can say that usually, after three entries into the overbought zone, there is at least a substantial correction. The CCI indicator may now form a bearish divergence and test its last local high.
We mentioned expecting a decline in the euro when the price first approached the 1.1000 level. The price was within a seven-month horizontal channel of 1.0600-1.1000 at that time. Now, the price has already broken the upper boundary of this channel several times, but the nature of the movement on the daily and weekly time frames has not changed significantly. Sideways movement within a limited price range still predominates. Therefore, if the decline does not start at the 1.1000 level but starts at 1.1050 or 1.1100, we will not be too disappointed.
The main reason for the U.S. dollar's latest decline is the market itself, which continues to wait for and believe in a 0.5% rate cut by the Federal Reserve in September. Recall that previously, it was expected to cut rates in March and June. All this time, any decrease in any inflation indicator in the U.S. has only been used to sell the American currency, even when the reports themselves do not suggest a decline in the dollar.
There will be very few important reports and events in the Eurozone in the upcoming week. We can only highlight the final estimate for inflation in July, which is unlikely to differ from the preliminary one, and the business activity indexes in the services and manufacturing sectors for August. All these reports have a very low probability of reversing the trend or significantly influencing market sentiment. However, we have determined that the pair is in a position where a strong downward movement is brewing. Therefore, in the upcoming week, we need to be prepared for a rise above the 1.1047 level, followed by a decline that could take the euro at least to the 1.0800 level.

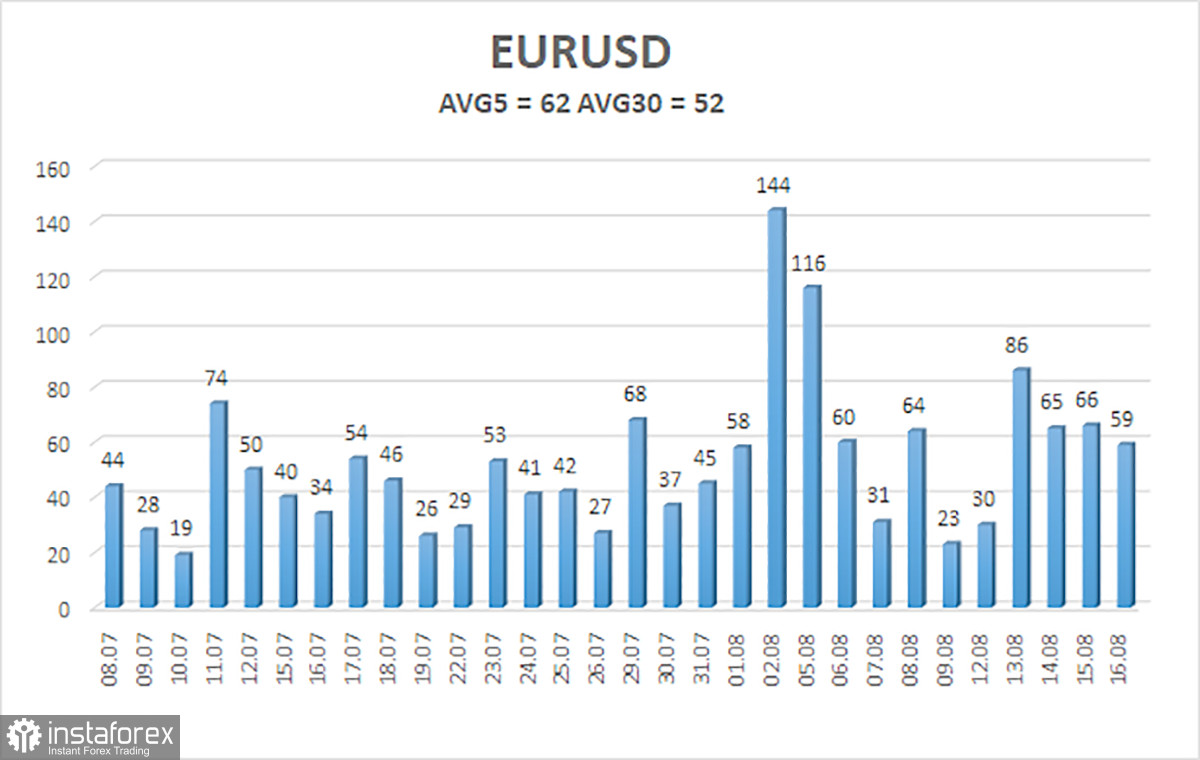
The average volatility of EUR/USD over the past five trading days as of August 18 is 62 pips, which is considered average. We expect the pair to move between the levels of 1.0966 and 1.1090 on Monday. The upper channel of the linear regression is directed upwards, but the global downtrend remains intact. The CCI indicator entered the overbought area for the third time, which warns not only of a possible trend reversal to the downside but also of how the current rise is entirely illogical.
Nearest Support Levels:
- S1 – 1.0986
- S2 – 1.0925
- S3 – 1.0864
Nearest Resistance Levels:
- R1 – 1.1047
- R2 – 1.1108
- R3 – 1.1169
We recommend checking out other articles by the author:
Review of GBP/USD on August 19; Preview of the week. An empty calendar and a vertical rise in the pound
Trading Recommendations:
The EUR/USD pair maintains a global downward trend, but in the 4-hour time frame, the upward movement has resumed, thanks to a new series of economic reports from the U.S. In previous reviews, we mentioned that we only expect declines from the euro in the medium term. We believe the euro cannot start a new global trend amid the European Central Bank's monetary policy easing, so the pair will likely fluctuate between 1.0600 and 1.1000 for some time. However, it is currently foolish to deny that the price is moving upward, and there are no signs of its end yet. The market continues to use any opportunity for purchases, but the technical picture warns of a high probability of the local uptrend ending.
Explanations for Illustrations:
Linear Regression Channels: help determine the current trend. If both are directed in the same direction, it means the trend is strong.
Moving Average Line (settings 20,0, smoothed): determines the short-term trend and the direction in which trading should be conducted.
Murray Levels: target levels for movements and corrections.
Volatility Levels (red lines): the probable price channel in which the pair will spend the next 24 hours, based on current volatility indicators.
CCI Indicator: Entering the oversold area (below 250) or the overbought area (above +250) means a trend reversal is approaching.


