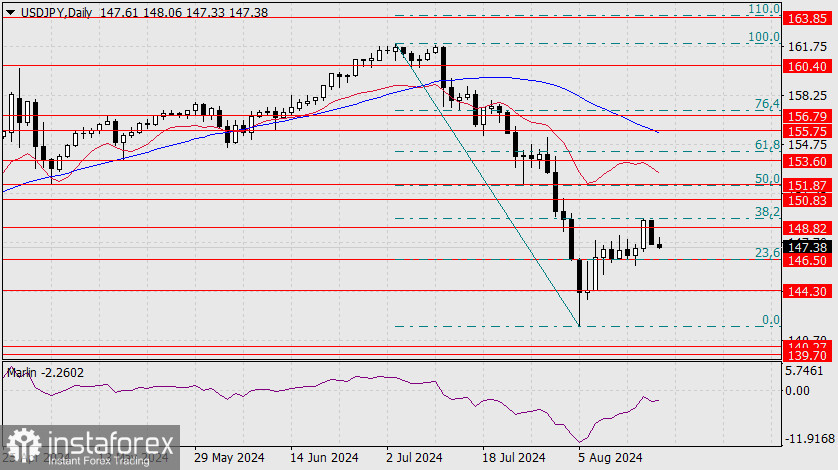
Last Thursday, the price clearly tested the 38.2% corrective level, and on Friday, it also made a notable pullback. Today, on the first day of the new week, the pair continues to decline toward the support level of 146.50, which aligns with the 23.6% Fibonacci level.

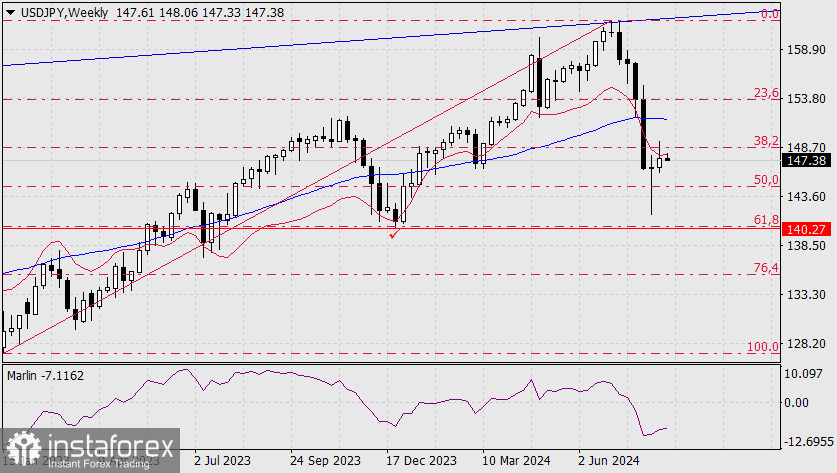
Earlier, from August 8 to August 14, the price unsuccessfully attempted to break below this apparently strong level. Accordingly, its expected breach would allow bears to push toward target levels of 144.30 and the range of 139.70-140.27 (the low of December 2023 and the 61.8% corrective level on the weekly chart).

Also note that the new week opened below the balance line, which reinforces the currency pair's bearish sentiment.

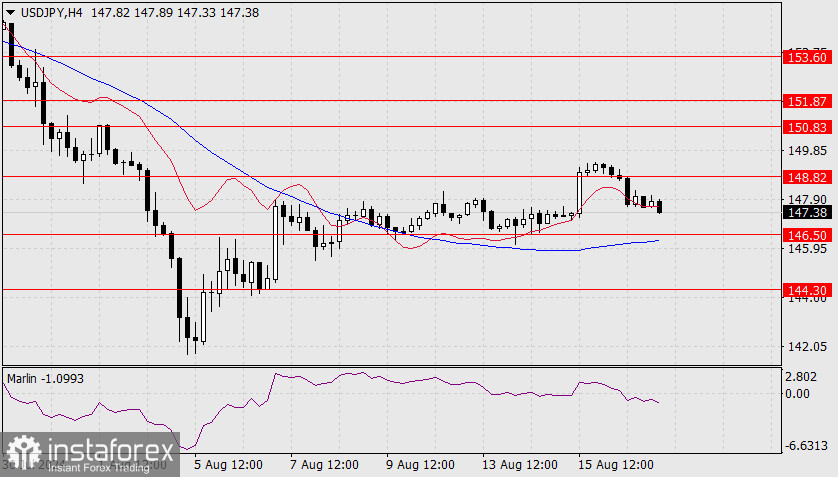
In the 4-hour chart, the price is breaking below the balance line with support from the Marlin oscillator, which is declining in negative territory. The MACD line, approaching the 146.50 level, emphasizes the importance of this support while simultaneously opening up the prospect of further medium-term decline for USD/JPY.


