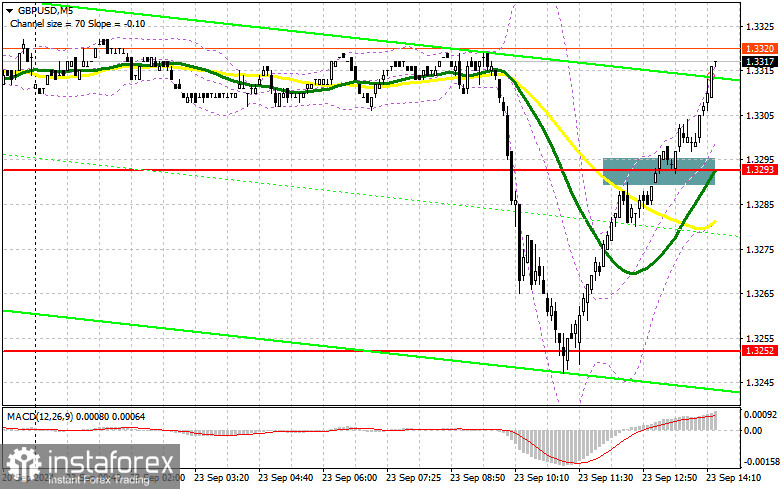
In my morning forecast, I emphasized the 1.3293 level and planned to make trading decisions based on it. Let's examine the 5-minute chart to see what happened. A breakout above 1.3293 took place, but there was no retest from the top down, meaning I missed suitable entry points in the market during the first half of the day. The technical outlook was updated for the second half of the day.

For opening long positions on GBP/USD:
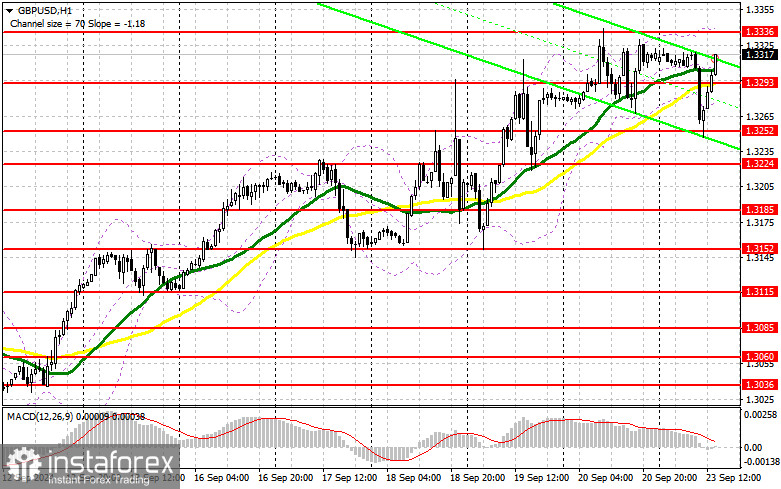
Buyers quickly recovered all the pound's losses from the morning, which were due to weak data on the UK's private sector activity. During the U.S. session, the continuation of GBP/USD's growth will depend on weak U.S. statistics. We expect data on the Manufacturing PMI, Services PMI, and Composite PMI for August. Only a significant divergence from economists' forecasts in a negative direction will trigger another upward surge for the pound. If the market reacts negatively, a false breakout around the new support level of 1.3293, which previously acted as resistance this morning, will provide an opportunity for the pair's continued growth toward 1.3336. A breakout and retest from the top down of this range will strengthen the chances of developing an upward trend, leading to the triggering of sellers' stop orders and providing a suitable entry point for long positions aiming for the 1.3390 level. The final target is 1.3435, where I plan to take profits. If GBP/USD declines and bulls show no activity around 1.3293 in the second half of the day, pressure on the pair will return, leading to a drop and a retest of the morning support at 1.3252. A false breakout there will be a suitable condition for opening long positions. I plan to buy GBP/USD on a rebound from the 1.3224 low, targeting a correction of 30-35 points within the day.
For opening short positions on GBP/USD:
Sellers did not act following a substantial morning sell-off in the British pound. Strong U.S. data might help them. If growth continues, I plan to act around the resistance level of 1.3336, which aligns with this month's high. A false breakout there will be a suitable entry point for selling the pound, targeting a test of the 1.3293 support, which served as resistance earlier in the day. A breakout and retest from the bottom up, as discussed above, will strike a blow to buyers' positions, clearing the path to 1.3252. The final target will be the 1.3185 level, where I will take profits. If GBP/USD rises and there's no bearish activity at 1.3336 in the second half of the day, buyers will continue pushing the pound higher, extending the bullish market. Bears will be forced to shift focus to the resistance level at 1.3390, where I will sell only on a false breakout. If there is no downward movement from there, I will look for short positions after a rebound around 1.3435, targeting for a downward correction of 30-35 points within the day.
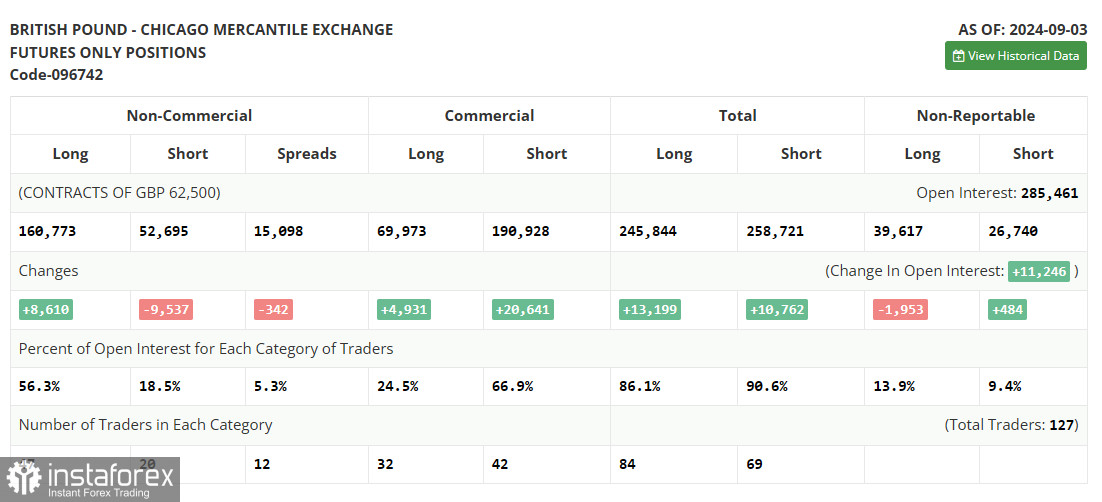
The COT (Commitment of Traders) report from September 3 showed an increase in long positions and a reduction in short ones. Clearly, despite the pair's correction, traders believe that the interest rate cuts in the U.S. are a more significant event than similar actions by the Bank of England. The market is likely factoring in expectations of lower borrowing costs in the UK, and demand for the pound is expected to return soon, given that the medium-term upward trend remains intact. The lower the pair goes, the more attractive it becomes for new buyers. The latest COT report indicated that long non-commercial positions rose by 8,610 to 160,773, while short non-commercial positions decreased by 9,537 to 52,695. Consequently, the spread between long and short positions narrowed by 342.
Indicator Signals:
Moving Averages:
Trading is occurring around the 30- and 50-day moving averages, indicating a sideways market.
Note: The period and prices of the moving averages are based on the hourly H1 chart and differ from the standard definition of classic daily moving averages on the daily D1 chart.
Bollinger Bands:
In case of a decline, the lower boundary of the indicator around 1.3275 will serve as support.
Description of Indicators:
- Moving Average (MA): Determines the current trend by smoothing out volatility and noise. Period 50, marked in yellow on the chart.
- Moving Average (MA): Determines the current trend by smoothing out volatility and noise. Period 30, marked in green on the chart.
- MACD (Moving Average Convergence/Divergence): EMA Fast period 12, EMA Slow period 26, SMA period 9.
- Bollinger Bands: Period 20.
- Non-commercial traders: Speculators such as individual traders, hedge funds, and large institutions using the futures market for speculative purposes and meeting certain requirements.
- Long non-commercial positions: Represent the total long open positions held by non-commercial traders.
- Short non-commercial positions: Represent the total short open positions held by non-commercial traders.
- Net non-commercial position: The difference between the short and long positions of non-commercial traders.


