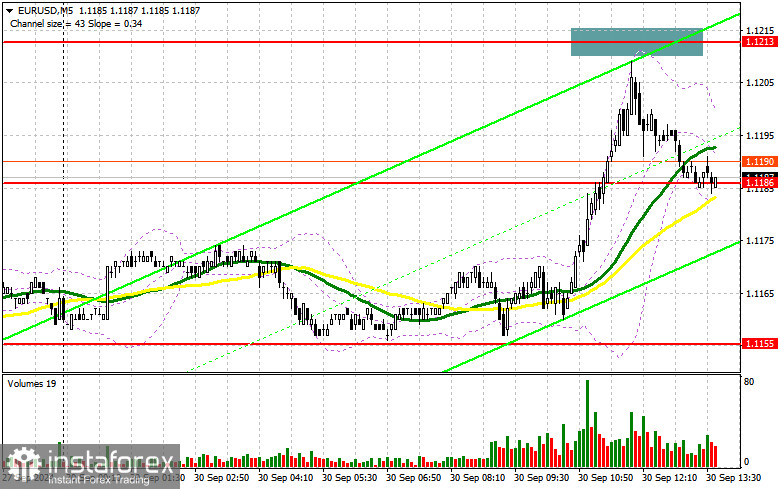
In my morning forecast, I planned to make trading decisions based on the 1.1213 level. Let's examine the 5-minute chart to understand what happened. Although there was a rise, the pair fell just a few points short of testing this level, leaving me without any trades. As a result, the technical picture for the second half of the day has been slightly revised.

Requirements for Opening Long Positions on EUR/USD:
The euro rose in the first half of the day, benefiting from strong demand for risk assets ahead of the speech by Federal Reserve Chairman Jerome Powell during the U.S. session. In addition, FOMC member Michelle Bowman is scheduled to speak, and the Chicago PMI index will be released. A dovish tone from policymakers would sustain demand for the euro and weaken the dollar, which I plan to capitalize on.
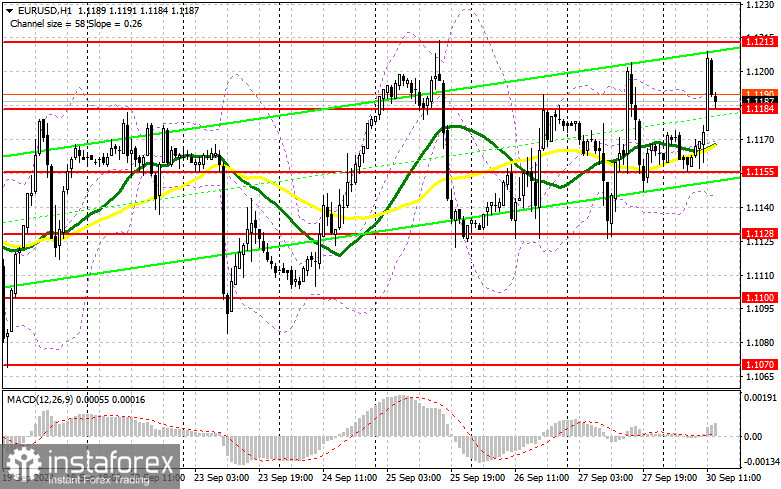
If there is a bearish reaction to the speeches, a false breakout around 1.1184 will provide a good opportunity to open new long positions, aiming for a return to the monthly high of 1.1213. A breakout and subsequent top-down retest of this range will lead to further growth of the pair, with a chance to test 1.1247. The ultimate target is 1.1274, though it's unlikely to be reached, and I'll take profits there.
If EUR/USD declines and shows no activity around 1.1184 in the second half of the day—and given that this level recently acted as resistance without showing much strength—pressure on the pair is likely to return, resulting in a more substantial sell-off by the month's end. In that scenario, I'll enter only after a false breakout around the next support level at 1.1155. I'll open long positions right off the bounce from 1.1128, targeting an upward correction of 30-35 points intraday.
Requirements for Opening Short Positions on EUR/USD:
Sellers have a chance to push the euro down, especially after the failed attempt to surpass the monthly high. If Powell's speech doesn't spark a strong bullish reaction today, I'll focus on defending the 1.1213 resistance level. Only a false breakout there will be a suitable condition for opening short positions, targeting a correction toward the 1.1184 support level.
I expect renewed buying activity at 1.1184, especially if U.S. data is weak. A breakout and consolidation below 1.1184, followed by a retest from the bottom up, will provide another selling opportunity, aiming for the 1.1155 level, where the moving averages, currently favoring buyers, are located. Here, I expect active action from the bulls. The ultimate target will be the 1.1128 level, which will nullify the bulls' plans for further growth, and I will take profits there.
If EUR/USD moves upward and bears are absent at 1.1213, the bulls will take control of the market. In this case, I'll postpone selling until the next resistance at 1.1237. I will also sell there but only after an unsuccessful consolidation. I'll open short positions immediately on the rebound from 1.1274, aiming for a downward correction of 30-35 points.

COT Report Analysis:
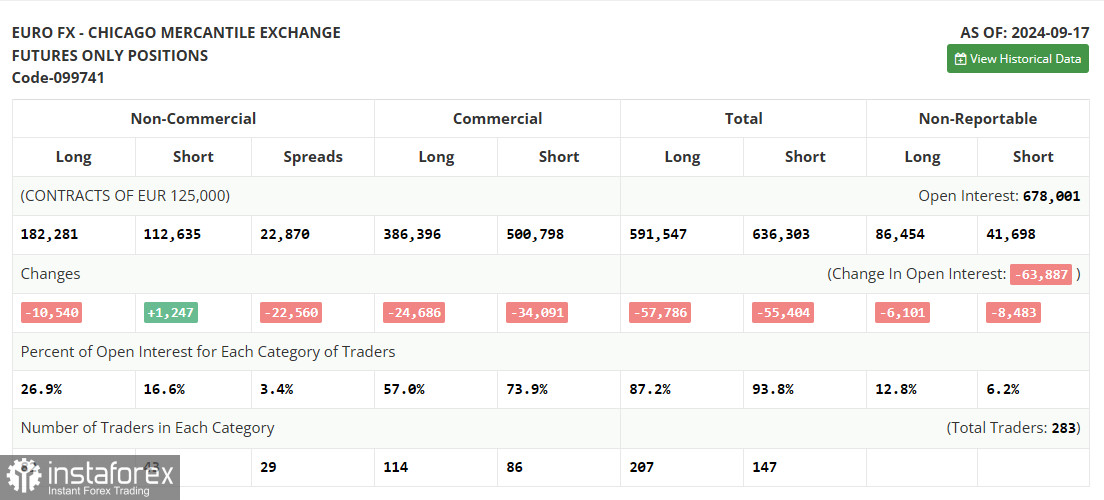
The Commitment of Traders (COT) report from September 17 indicated a reduction in long positions and a slight increase in short positions. The Federal Reserve's decision to cut rates by 0.5% was unexpected, yet traders did not significantly adjust their positions, favoring the euro's strengthening over the U.S. dollar. In the near term, we only expect speeches from several Federal Reserve and European Central Bank representatives without any major fundamental statistics, so market volatility might decrease.
However, this doesn't alter the medium-term uptrend for the euro, and the lower the pair goes, the more attractive it becomes for buying. According to the COT report, long non-commercial positions decreased by 10,540 to 182,281, while short positions rose by 1,247 to 112,635. As a result, the gap between long and short positions narrowed by 20,560.
Indicator Signals:
Moving Averages:
Trading is conducted above the 30- and 50-day moving averages, indicating euro growth.
Note: The period and prices of moving averages are considered by the author on the H1 hourly chart and differ from the general definition of classical daily moving averages on the D1 daily chart.
Bollinger Bands:
If the pair declines, the lower boundary of the indicator around 1.1140 will act as support.
Indicator Descriptions:
- Moving Average: Determines the current trend by smoothing volatility and noise. Period 50, marked in yellow on the chart.
- Moving Average: Determines the current trend by smoothing volatility and noise. Period 30, marked in green on the chart.
- MACD Indicator (Moving Average Convergence/Divergence): Fast EMA period 12, Slow EMA period 26, SMA period 9.
- Bollinger Bands: Period 20.
- Non-commercial traders: Speculators, such as individual traders, hedge funds, and large institutions, use the futures market for speculative purposes and meet specific requirements.
- Long non-commercial positions: The total long open positions held by non-commercial traders.
- Short non-commercial positions: The total short open positions held by non-commercial traders.
- Total non-commercial net position: The difference between short and long positions of non-commercial traders.


