Analysis of Thursday's Trades
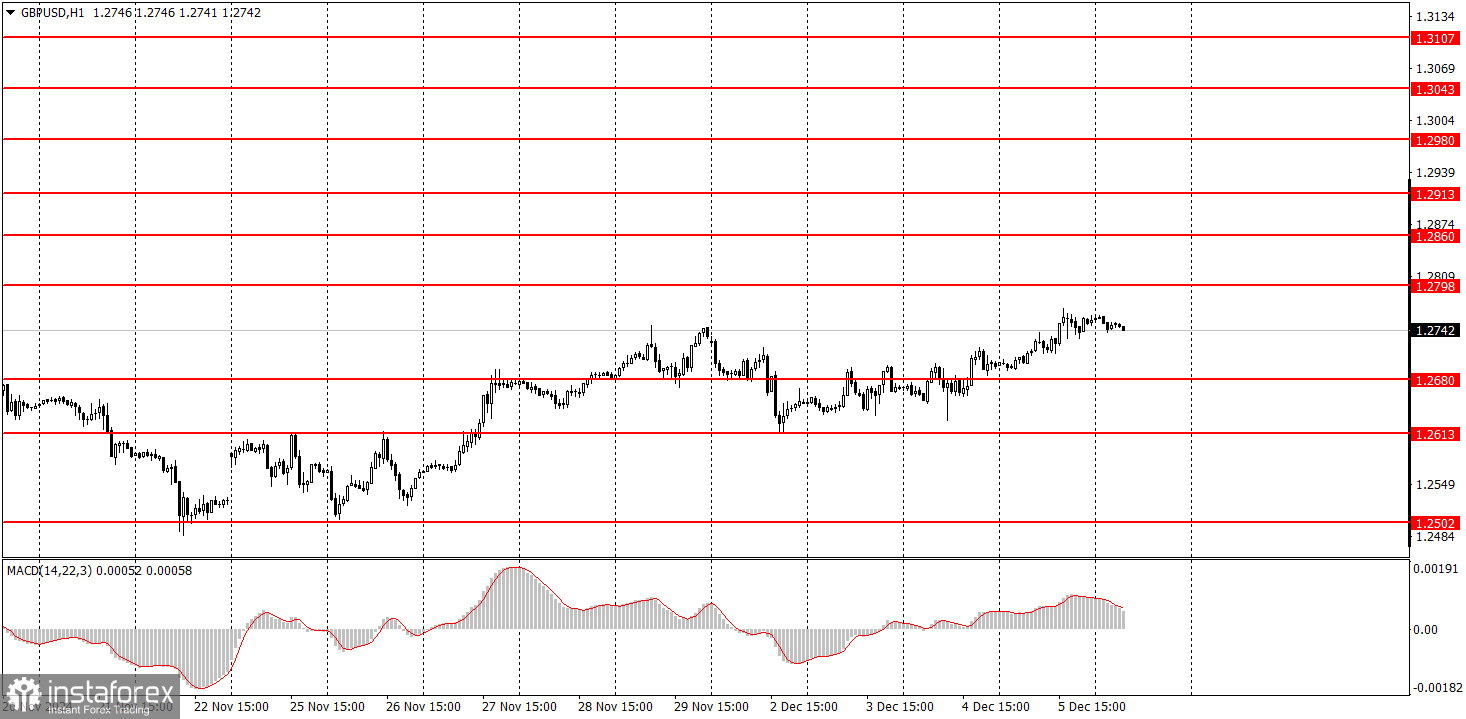
1H Chart of GBP/USD

The GBP/USD pair continued its upward movement on Thursday as part of a correction that began two weeks ago. As we've mentioned several times, there are no substantial reasons for the British pound to rise other than technical factors. On Thursday (or Wednesday), there were no strong reasons to buy the pound. Neither the UK nor the US had noteworthy events, so this remains purely a technical correction.
Theoretically, this corrective movement could last several weeks, as corrections typically take longer than impulsive moves. However, the pair may see significant volatility during the US trading session due to critical macroeconomic data. Even a 100-pip drop wouldn't conclusively signal the end of the correction. At the same time, we still believe that long positions are irrelevant. The pound has the potential to decline by at least 500–600 pips.
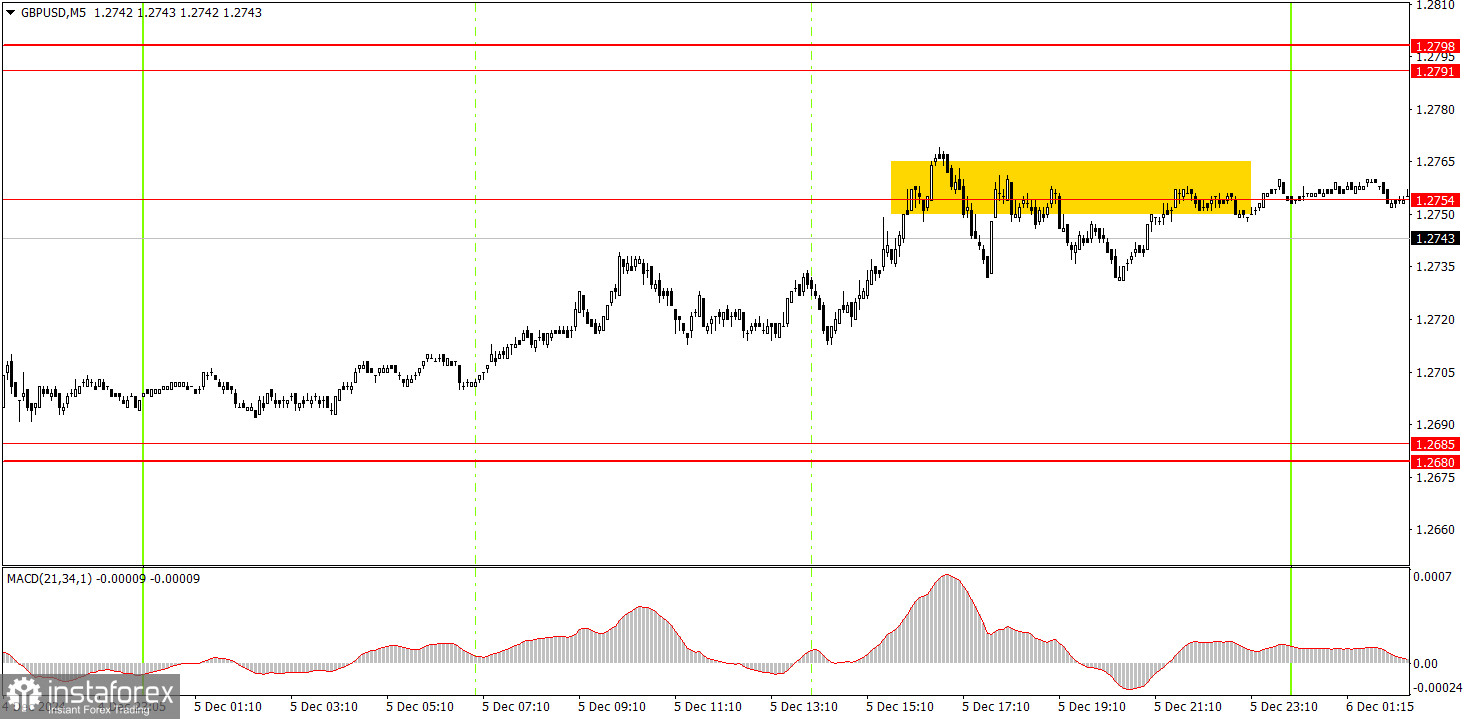
5M Chart of GBP/USD

On Thursday's 5-minute timeframe, there were no noteworthy trading signals. The price trended upward throughout the day, moving from the 1.2680–1.2685 zone toward 1.2754. A buy signal near the 1.2680–1.2685 area was formed on Wednesday. However, no clear sell signal emerged upon reaching 1.2754. Therefore, we believe trading the pound on Thursday was not particularly meaningful.
Trading Strategy for Friday:
On the hourly timeframe, GBP/USD continues to correct after a two-month decline. We fully support the pound's further decline in the medium term, considering it the only logical outcome. The pound is correcting purely based on technical patterns, which could continue for some time.
On Friday, novice traders can expect a potential decline in the British pound. However, movements are currently highly erratic, and any rise should be considered part of the correction. The macroeconomic background today could drive movements in either direction.
On the 5-minute TF, you can now trade at 1.2387, 1.2445, 1.2502-1.2508, 1.2547, 1.2633, 1.2680-1.2685, 1.2754, 1.2791-1.2798, 1.2848-1.2860, 1.2913, 1.2980-1.2993. On Friday, there are no scheduled events in the UK, while the US will release at least four significant reports, including NonFarm Payrolls, Unemployment Rate, Wages, and Consumer Sentiment (University of Michigan).
Core Trading System Rules:
- Signal Strength: The shorter the time it takes for a signal to form (a rebound or breakout), the stronger the signal.
- False Signals: If two or more trades near a level result in false signals, subsequent signals from that level should be ignored.
- Flat Markets: In flat conditions, pairs may generate many false signals or none at all. It's better to stop trading at the first signs of a flat market.
- Trading Hours: Open trades between the start of the European session and the middle of the US session, then manually close all trades.
- MACD Signals: On the hourly timeframe, trade MACD signals only during periods of good volatility and a clear trend confirmed by trendlines or trend channels.
- Close Levels: If two levels are too close (5–20 pips apart), treat them as a support or resistance zone.
- Stop Loss: Set a Stop Loss to breakeven after the price moves 15 pips in the desired direction.
Key Chart Elements:
Support and Resistance Levels: These are target levels for opening or closing positions and can also serve as points for placing Take Profit orders.
Red Lines: Channels or trendlines indicating the current trend and the preferred direction for trading.
MACD Indicator (14,22,3): A histogram and signal line used as a supplementary source of trading signals.
Important Events and Reports: Found in the economic calendar, these can heavily influence price movements. Exercise caution or exit the market during their release to avoid sharp reversals.
Forex trading beginners should remember that not every trade will be profitable. Developing a clear strategy and practicing proper money management are essential for long-term trading success.


