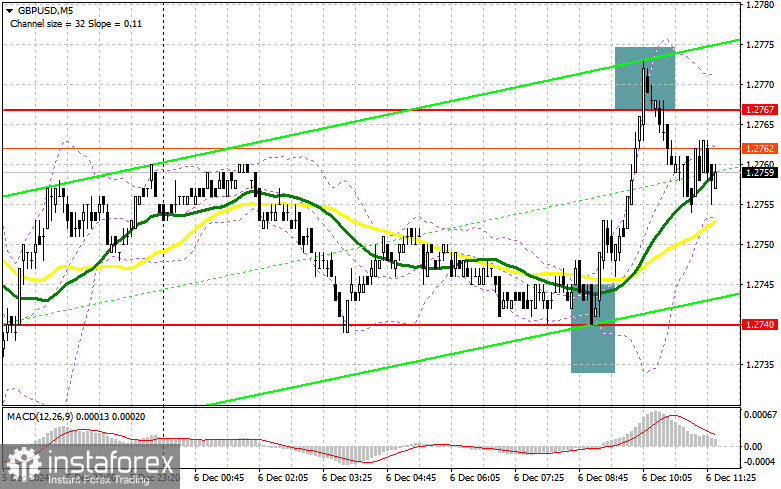
In my morning forecast, I highlighted the 1.2767 level as a key area for making trading decisions. We will review the 5-minute chart to analyze the developments. The rise and subsequent false breakout at this level provided a good selling opportunity, leading to a 15-point decline by the time of writing. Earlier, a false breakout near the 1.2740 support level generated a strong signal, allowing for a 25-point gain. The technical picture has been revised for the second half of the day.

To Open Long Positions on GBP/USD:
The pound continues to rally despite the absence of significant UK economic data. However, its trajectory will depend on U.S. reports on the unemployment rate, nonfarm payrolls, and average hourly earnings. Weaker-than-expected indicators could help the pound break above its weekly high. Additionally, pay attention to the University of Michigan Consumer Sentiment Index and inflation expectations. On the other hand, strong U.S. statistics could boost dollar demand, leading to a decline in GBP/USD.
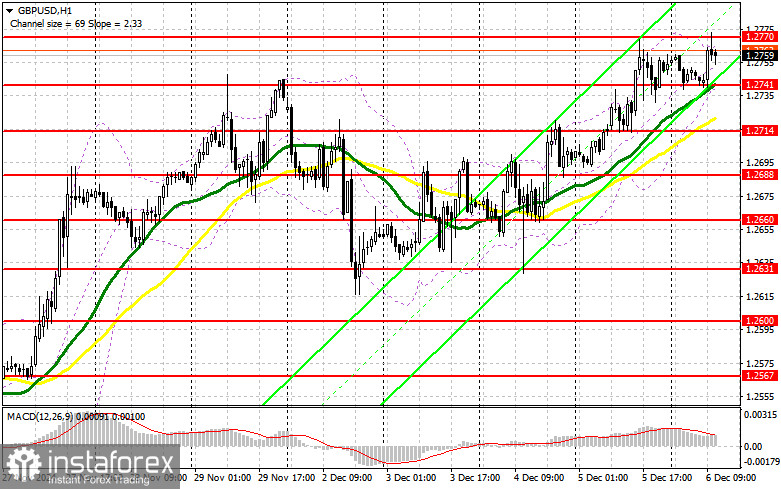
The 1.2741 support level will be critical for buyers to defend. If GBP/USD falls, I will look for long positions after a false breakout at this level, aiming for a recovery towards the 1.2770 resistance. A breakout above this resistance, followed by a retest, could offer another entry point for long positions, targeting 1.2800. The ultimate target will be the 1.2827 level, where I plan to take profits.
If GBP/USD declines and there is no activity from buyers near 1.2741, the momentum will shift to the bears, increasing the likelihood of a deeper drop toward the end of the week. A false breakout near 1.2714 would be the only suitable condition for opening long positions. Alternatively, I will consider buying GBP/USD on a rebound from 1.2688, aiming for an intraday correction of 30–35 points.
To Open Short Positions on GBP/USD:
Pressure on the pound could return if U.S. labor market statistics significantly exceed expectations. In this case, defending the 1.2770 resistance will remain a key objective for sellers. I will open short positions only after observing a false breakout at this level. This approach would provide a selling opportunity, targeting the 1.2741 support level, where the moving averages currently favor buyers.
A breakout below 1.2741, followed by a retest from below, could trigger further declines, leading to a move toward 1.2714. The final target for sellers would be the 1.2688 level, where I plan to take profits. If weaker U.S. data sustains demand for the pound and GBP/USD rises while sellers remain inactive around 1.2770, buyers could gain further momentum, pushing the pair toward the 1.2800 resistance. In this scenario, I will sell only after a false breakout at this level. If there is no downward movement even at 1.2800, I will look for short positions near 1.2827, targeting a 30–35 point correction.

Commitment of Traders (COT) Report Insights:
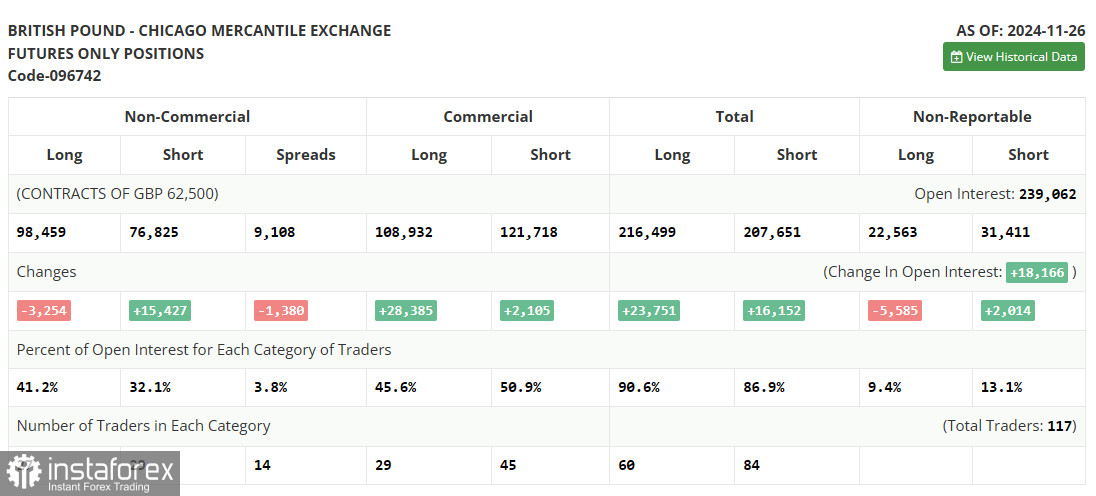
As of November 26, the COT report showed the following:
- A reduction of 3,254 long positions, leaving the total at 98,459.
- A significant increase in short positions (+15,427 to 76,825).
The Bank of England's decision to refrain from additional rate cuts has been unfavorable for pound buyers, although under normal circumstances, such a move would support the currency. Weak UK economic data continues to exert downward pressure on GBP/USD, while inflation concerns and potential U.S. tariffs add further uncertainty for traders and investors.

Indicator Signals:
Moving Averages
Trading remains above the 30- and 50-period moving averages, suggesting continued growth for the pair.Note: The moving averages are based on the hourly chart (H1) and differ from the standard definition of daily moving averages used on the D1 chart.
Bollinger Bands
In case of a decline, the lower boundary of the Bollinger Bands near 1.2741 will act as support.
Indicator Descriptions:
- Moving Average (MA): Identifies trends by smoothing out volatility and noise.
- Period 50: Yellow on the chart.
- Period 30: Green on the chart.
- MACD (Moving Average Convergence/Divergence): A momentum indicator that highlights trend direction.
- Fast EMA: Period 12.
- Slow EMA: Period 26.
- SMA: Period 9.
- Bollinger Bands: An indicator that identifies potential support and resistance levels.
- Period: 20.
- Non-commercial traders: Speculators, including individual traders, hedge funds, and large institutions, using the futures market for speculative purposes.
- Long Non-commercial Positions: The total long positions held by non-commercial traders.
- Short Non-commercial Positions: The total short positions held by non-commercial traders.
- Net Non-commercial Position: The difference between short and long positions held by non-commercial traders.


