To Open Long Positions on EUR/USD:
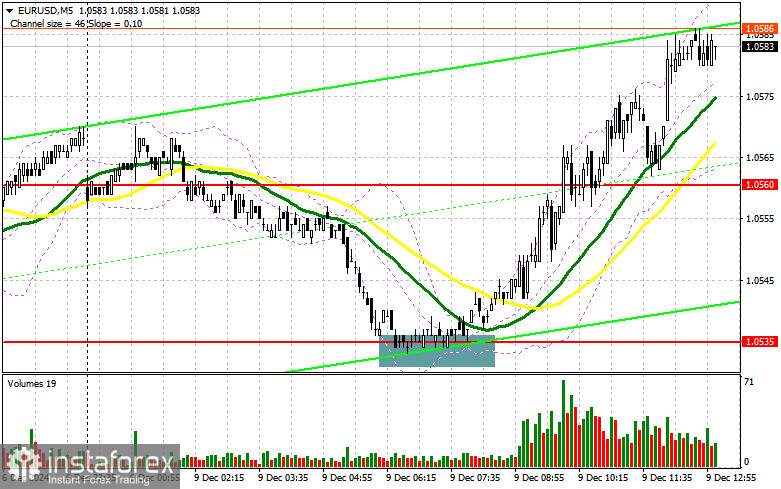
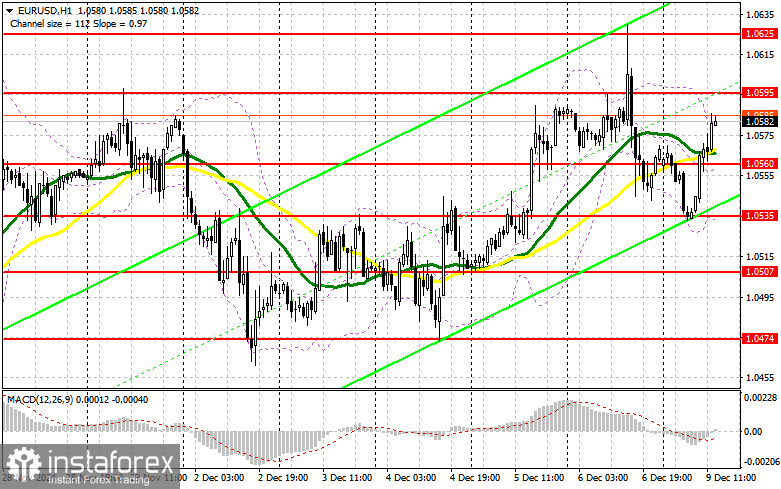
The lack of significant U.S. statistics today will play a key role in supporting euro demand, increasing the chances of a return to last week's highs. Data on wholesale inventory changes in the U.S. are unlikely to significantly impact market dynamics. For this reason, I prefer to act around the 1.0560 support level. Only a false breakout there would provide a suitable condition for increasing long positions, aiming for another rise to the 1.0595 level, which has so far been hard to surpass.
A breakout and retest of this range would confirm a valid buying point, with the next targets being 1.0625 (last week's high) and 1.0653 (the ultimate target for profit-taking). Testing this level would strengthen the bullish euro market.
If EUR/USD declines and there is no activity around 1.0560 in the second half of the day, pressure on the pair will increase, leading to consolidation within a sideways channel. In this case, I would consider entering long positions only after a false breakout near the 1.0535 support level. Immediate long positions on a rebound are planned at 1.0507, aiming for a 30–35-point intraday correction.
To Open Short Positions on EUR/USD:
Defending the 1.0595 resistance remains a priority for sellers in the second half of the day. A false breakout there would provide a good entry point for short positions, targeting a decline toward the 1.0560 support level, where the moving averages, favoring sellers, are located. A breakout and consolidation below this range, followed by a retest from below, would be another signal to sell, with the target set at 1.0535. The ultimate target for short positions is 1.0507, where profits should be locked in.
If EUR/USD rises in the second half of the day and bears show no activity around 1.0595, selling should be postponed until the next resistance at 1.0625 is tested. Short positions can be opened there after a failed consolidation. Immediate short positions on a rebound are planned at 1.0653, targeting a 30–35-point downward correction.

COT Report (Commitments of Traders):
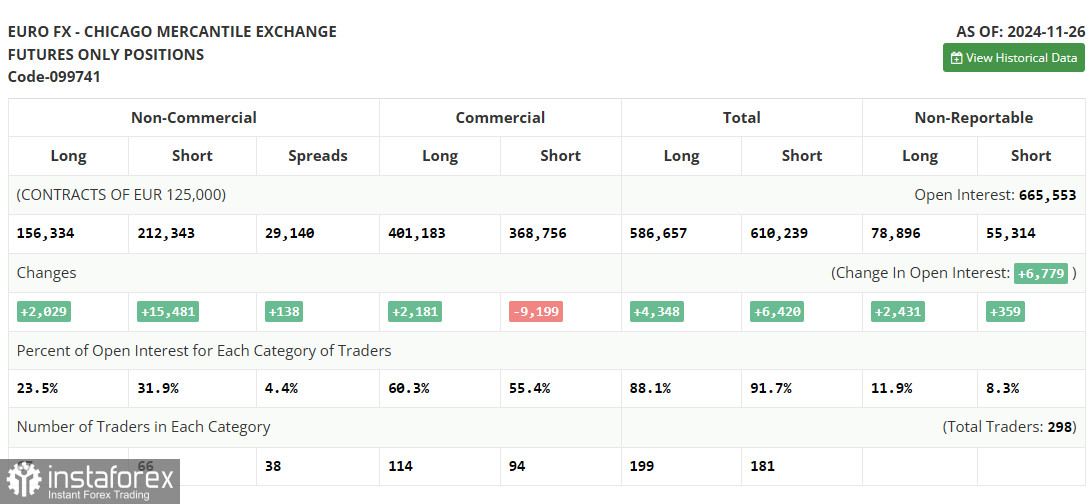
The COT report for November 26 showed a significant increase in short positions and a small rise in long ones. The Federal Reserve's cautious approach to rate cuts makes the U.S. dollar more attractive than risk assets, including the euro.
With President Trump promising 100% punitive tariffs on BRICS countries even before taking office, market pressure on risk assets is intensifying. According to the COT report, non-commercial long positions increased by 2,029 to 156,334, while short positions rose by 15,481 to 212,343, widening the gap between long and short positions by 138.

Indicator Signals:
Moving Averages:Trading above the 30- and 50-day moving averages suggests the euro's attempts to continue its growth.
- 30-period SMA (green) and 50-period SMA (yellow) on the hourly chart are key indicators of current trends.
- MACD Indicator: Fast EMA – 12, Slow EMA – 26, SMA – 9.
Bollinger Bands:The lower boundary of the Bollinger Bands around 1.0535 serves as support in case of a decline.
Key Definitions of Indicators:
- Moving Average (SMA): Smoothens volatility to identify trends.
- Bollinger Bands: Measures volatility and potential support/resistance levels.
- MACD: Tracks moving average convergence/divergence for trend signals.
- Non-commercial traders: Speculators using the futures market for profit purposes.
- Long and short positions: Reflect the open bullish or bearish speculative trades.


