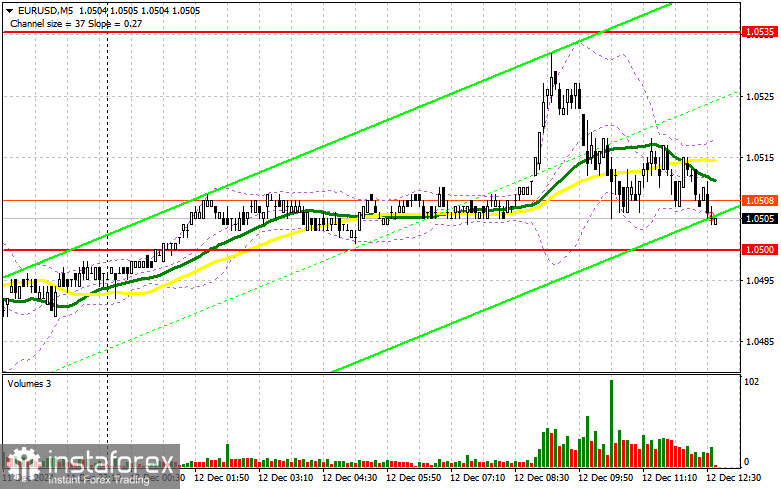
In my morning forecast, I highlighted the 1.0535 level as a key point for making trading decisions. Let's analyze the 5-minute chart to see what happened. While the pair showed growth, it fell just a couple of points short of testing 1.0535, leaving me without any trades. The technical outlook for the second half of the day remains unchanged.

To Open Long Positions on EUR/USD:
There was little interest in buying the euro during the first half of the day, especially ahead of the important European Central Bank (ECB) meeting, where interest rate cuts are expected. As a result, the pair failed to break above 1.0535.
We've already discussed the ECB decision in the morning analysis, so let's now focus on U.S. data. Initial Jobless Claims and the Producer Price Index (PPI) are significant indicators that could cause volatility in the second half of the day. A decrease in jobless claims and an increase in producer prices, particularly core prices, would likely strengthen the dollar against the euro.
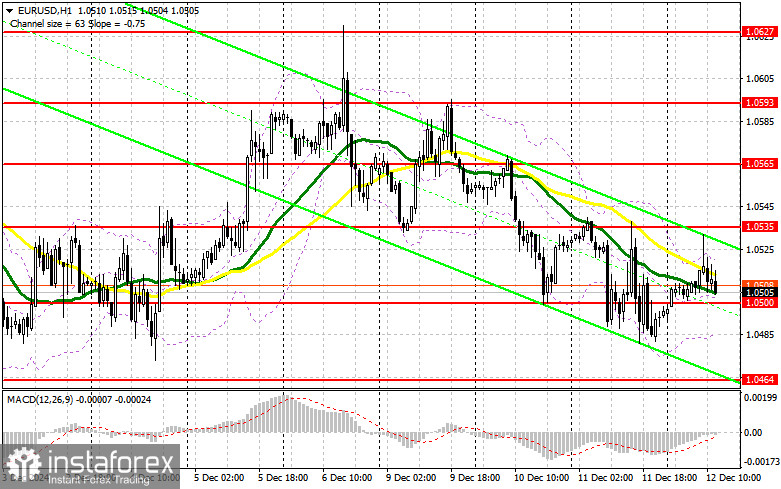
If the pair remains under pressure following the data release, I will act around the 1.0464 support level. A false breakout there would create a good buying opportunity, aiming for a recovery towards 1.0500. A breakout and retest of this range would confirm a proper entry point for long positions, targeting a retest of 1.0535. The ultimate target would be the 1.0565 high, where I plan to take profit. Testing this level could revive hopes for a bullish market in the euro.
If EUR/USD declines and there is no buyer activity near 1.0464, pressure on the pair will likely intensify, leading to a more significant drop. In this case, I will wait for a false breakout around 1.0430 before considering longs. I will open long positions immediately on a rebound from 1.0394, aiming for an intraday correction of 30-35 points.
To Open Short Positions on EUR/USD:
If the euro rises following the ECB decision, protecting the 1.0535 resistance will be the sellers' priority in the second half of the day. A false breakout at this level would signal a selling opportunity, targeting a decline to the 1.0500 support level. A breakout and retest from below this range would create another opportunity to sell, aiming for a move to the 1.0464 low, which would shift market momentum back to the bears. The ultimate target would be the 1.0430 area, where I plan to take profit.
If EUR/USD climbs further in the second half of the day and bears show no activity around 1.0535, likely requiring the ECB to abandon its rate-cut plans, I will postpone selling until the pair tests the next resistance at 1.0565. I will sell there only after an unsuccessful consolidation. Short positions will also be opened on a rebound from 1.0593, targeting a downward correction of 30-35 points.

Commitments of Traders (COT) Report:
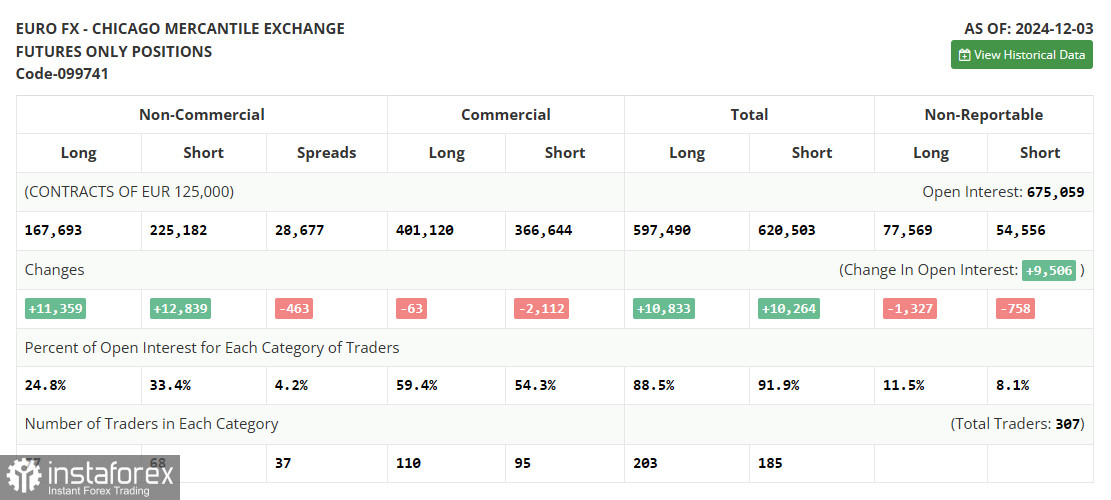
The COT report for December 3 showed a significant increase in both short and long positions, leaving the market's balance of power virtually unchanged. Key upcoming U.S. inflation data will influence monetary policy and the dollar's trajectory. If the figures don't show notable changes, the Federal Reserve will likely cut interest rates, further weakening the dollar.
- Long non-commercial positions increased by 11,359 to 167,693.
- Short non-commercial positions increased by 12,839 to 225,182.
- The gap between long and short positions narrowed by 463.

Indicator Signals:
Moving AveragesTrading is taking place around the 30- and 50-day moving averages, indicating market uncertainty.
Note: The moving average periods and prices are based on the hourly (H1) chart and may differ from the daily (D1) chart's classic definitions.
Bollinger BandsIn the event of a decline, the lower boundary of the indicator near 1.0480 will act as support.
Indicator Descriptions:
- Moving Average (MA): Defines the current trend by smoothing volatility and noise.
- 50-period MA is marked in yellow.
- 30-period MA is marked in green.
- MACD: Measures the convergence/divergence of moving averages.
- Fast EMA: 12-period
- Slow EMA: 26-period
- SMA: 9-period
- Bollinger Bands: Period – 20.
- Non-commercial traders: Speculators like individual traders, hedge funds, and institutions trading for speculative purposes.
- Long positions: Total open long positions by non-commercial traders.
- Short positions: Total open short positions by non-commercial traders.
- Net non-commercial position: Difference between short and long positions.


