


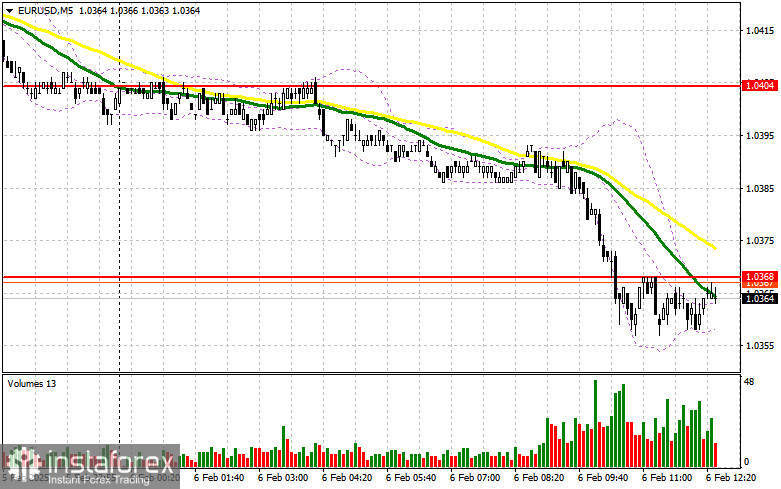
In my morning forecast, I highlighted the 1.0368 level and planned to make trading decisions based on it. Let's analyze the 5-minute chart and see what happened. The break and retest of 1.0368 did not provide a valid entry point for selling the euro, as the pair moved only slightly below this level before stabilizing. As a result, I did not enter any trades. The technical outlook has been revised for the second half of the day.
To open long positions on EURUSD, you need:
Although today's German industrial orders data significantly exceeded economists' forecasts, weak Eurozone retail sales for December continued the downtrend observed since yesterday's second half of the session. The upcoming U.S. economic data will be equally important.
The weekly jobless claims report is not as significant as yesterday's ADP report, but it still provides insights into the labor market. The speeches of FOMC members Christopher Waller and Mary Daly could have a stronger impact on the pair's direction. A dovish tone from policymakers could once again weaken the U.S. dollar, similar to what was seen earlier this week. Conversely, strong data would reinforce the bearish correction, making it risky to rush into buy positions.
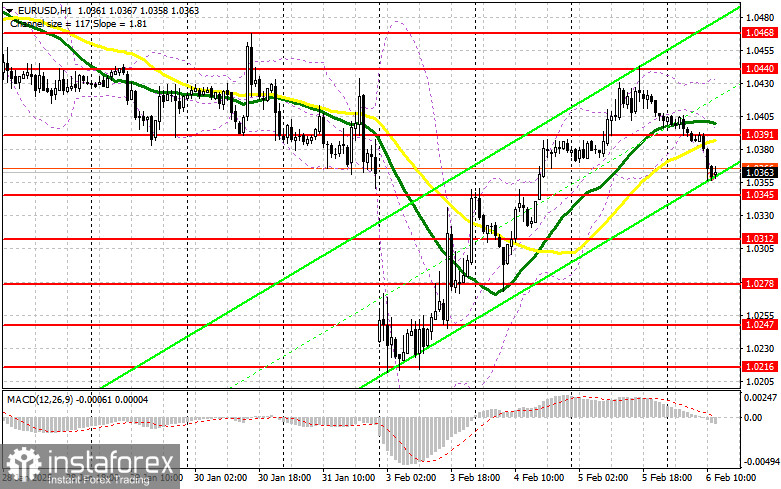
If EUR/USD declines, a false breakout around 1.0345 will provide a good buying opportunity, targeting 1.0391 resistance. A breakout and retest of this level from above will confirm a bullish entry, aiming for 1.0440. The final target will be 1.0468, where I plan to take profit.
If the pair drops and buyers show no activity at 1.0345, the euro will face serious difficulties, allowing sellers to push it down to 1.0312. Only a false breakout at this level will serve as a buying opportunity. I plan to enter long positions from 1.0278, expecting a 30-35 point intraday rebound.
To open short positions on EURUSD, you need:
Traders are locking in profits on risk assets ahead of tomorrow's key U.S. labor market data. If the Fed speakers deliver hawkish comments, bearish positions should be considered near 1.0391, where the moving averages align in favor of the sellers. A false breakout at this level will confirm large sellers' presence, providing a short entry targeting 1.0345 support. A break and retest of 1.0345 from below will confirm a stronger decline toward 1.0312, potentially invalidating the bullish trend. The final target will be 1.0278, where I plan to take profit.
If EUR/USD rises in the second half of the day and sellers fail to defend 1.0391, the market will shift back in favor of buyers. In this case, I will wait for a test of 1.0440 to sell but only after a failed breakout. If the price continues rising, I will sell from 1.0468, expecting a 30-35 point pullback.
COT Report Analysis:
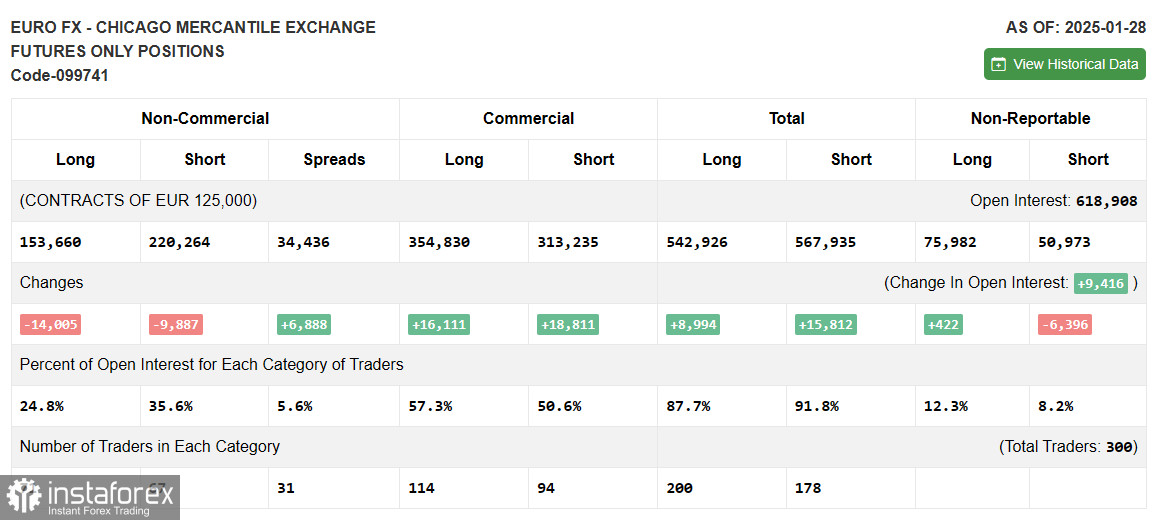
The Commitment of Traders (COT) report for January 28 showed a sharp decline in both long and short positions. There are fewer buyers, but sellers have not significantly increased either. This report does not reflect recent market changes following Trump's new tariffs on China, Mexico, and Canada, so its relevance is limited.
However, sellers still dominate the market, indicating that EUR/USD remains in a bearish trend. The number of long non-commercial positions dropped by 14,005 to 153,660, while short positions declined by 9,887 to 220,264. As a result, the gap between long and short positions increased by 6,888.
Technical Indicators
Moving Averages
The pair trades below the 30- and 50-period moving averages, confirming a bearish trend for the euro.
Bollinger Bands
If the price falls, the lower Bollinger Band near 1.0370 will act as support.
Key Indicator Descriptions:
- Moving Average (50-period, yellow line) – Identifies the current trend by smoothing volatility.
- Moving Average (30-period, green line) – Identifies shorter-term trend movements.
- MACD (Moving Average Convergence/Divergence):
- Fast EMA – 12-period
- Slow EMA – 26-period
- SMA – 9-period
- Bollinger Bands (20-period): Measures price volatility and potential overbought/oversold conditions.
- Non-commercial traders: Speculative traders (hedge funds, large institutions) using the futures market for speculative purposes.
- Long non-commercial positions: Total open long positions by speculators.
- Short non-commercial positions: Total open short positions by speculators.
- Net non-commercial position: The difference between short and long positions among speculators.


