


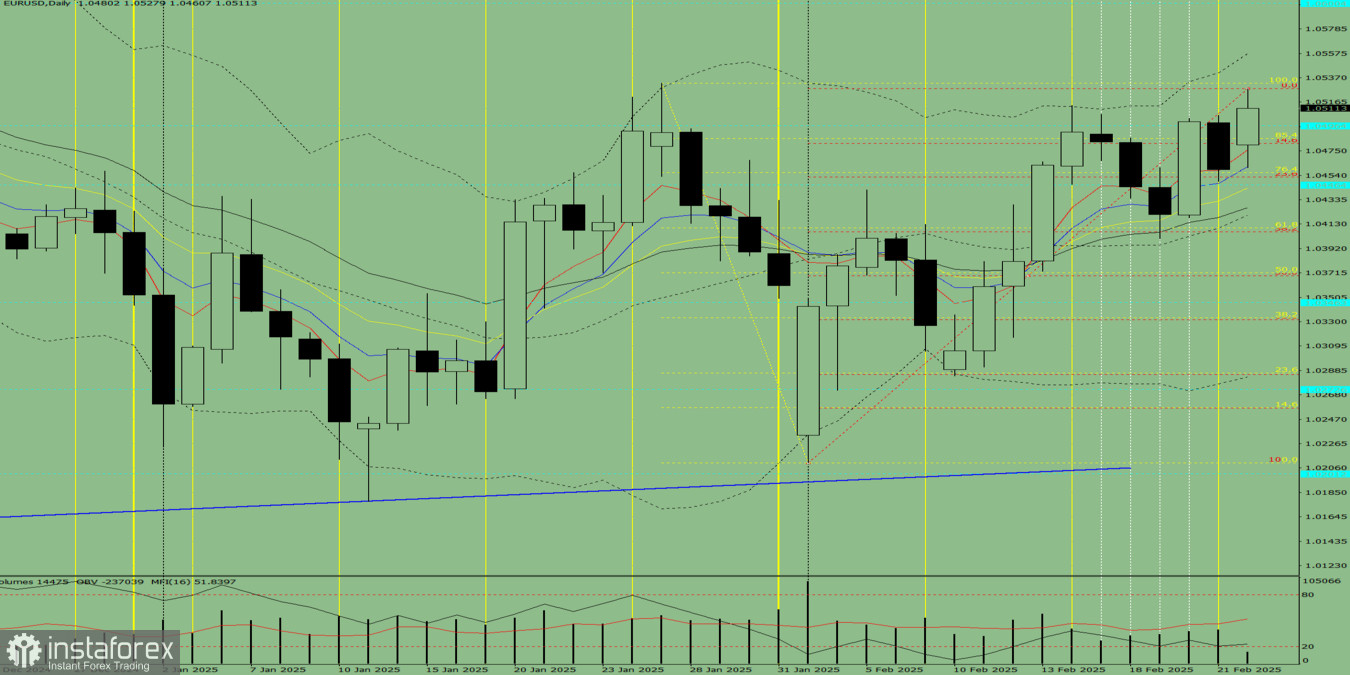
Trend Analysis (Fig. 1)
On Monday, the market may start an upward movement from the level of 1.0459, targeting 1.0532— the upper fractal (yellow dashed line). If this level is reached, further price growth towards 1.0558—the upper boundary of the Bollinger Bands indicator (black dashed line)—is possible.
Comprehensive Analysis:
- Indicator analysis: Up
- Fibonacci levels: Up
- Volumes: Up
- Candlestick analysis: Up
- Trend analysis: Up
- Bollinger Bands: Up
- Weekly chart: Up
General Conclusion:
A bullish trend is expected.
Alternative Scenario:
The price may start an upward movement from 1.0459 towards 1.0532 (yellow dashed line). Upon reaching this level, a retracement downwards to 1.0496—historical support (blue dashed line)—is possible.


