


Trend Analysis
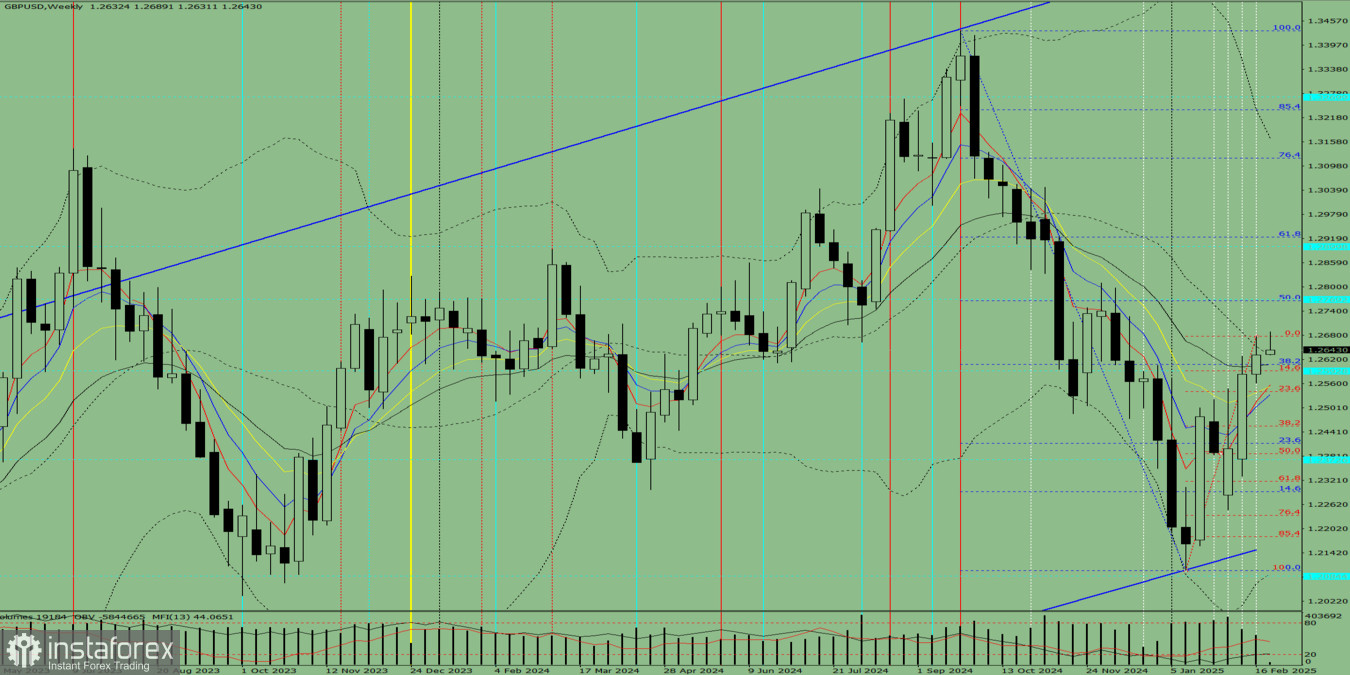
This week, the price may start moving downward from 1.2631 (the closing level of the last weekly candle), targeting 1.2540—the 23.6% retracement level (red dashed line). Upon testing this level, the price could reverse upwards toward 1.2689—the upper fractal (red dashed line).
Comprehensive Analysis:
- Indicator analysis: Down
- Fibonacci levels: Down
- Volumes: Down
- Candlestick analysis: Down
- Trend analysis: Down
- Bollinger Bands: Down
- Monthly chart: Down
Conclusion: Bearish Movement Expected
Based on the weekly chart projection, GBP/USD is likely to follow a downward trend, with no initial upper shadow on the weekly black candle (Monday – down) and the presence of a lower shadow on Friday indicating a potential upward retracement.
Alternative Scenario
The price may initially decline from 1.2631 toward 1.2592 (14.6% retracement level, red dashed line). If tested, the price could then initiate an upward movement toward 1.2765—the 50% retracement level (blue dashed line).


