


Trend Analysis (Figure 1)
On Thursday, from the level of 1.0483 (yesterday's daily close), the market may continue its downward movement, targeting 1.0453 – the 23.6% retracement level (red dashed line). From this level, the price could rebound upward towards 1.0496 – a historical support level (blue dashed line).
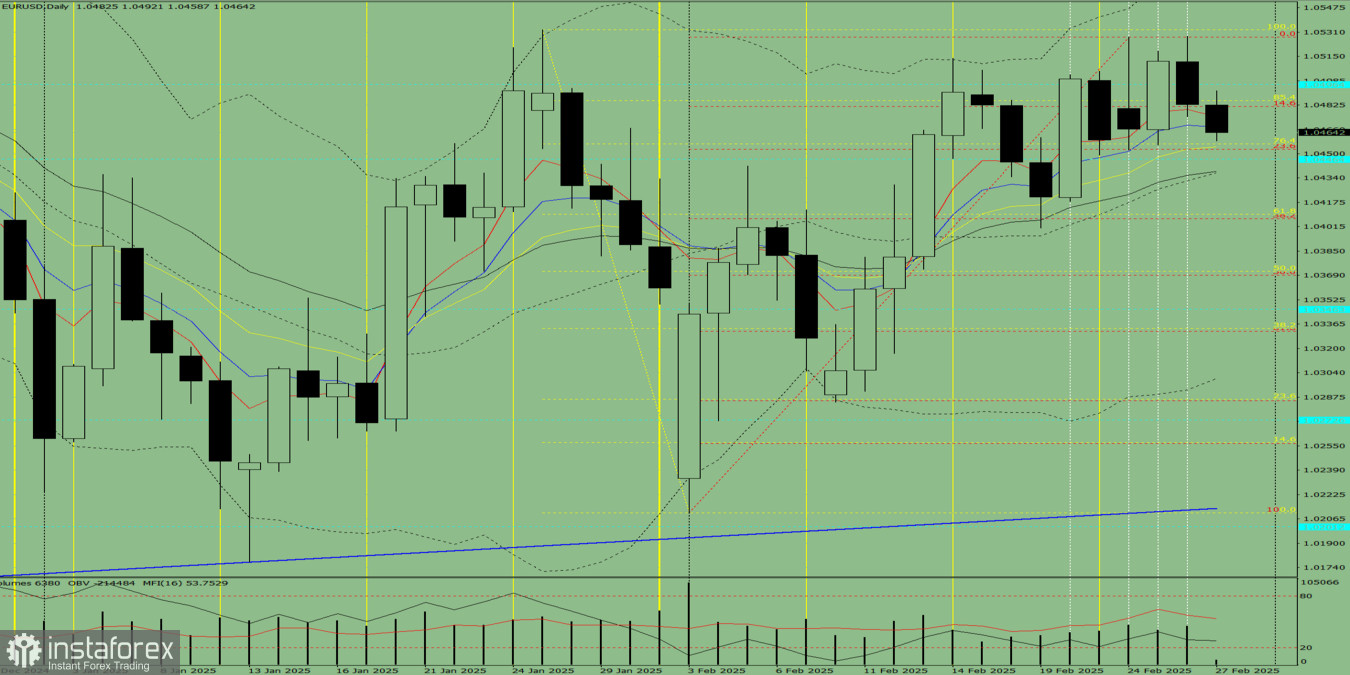
Figure 1: Daily Chart
Comprehensive Analysis Summary:
- Indicator Analysis – Down
- Fibonacci Levels – Down
- Volume Analysis – Down
- Candlestick Analysis – Down
- Trend Analysis – Up
- Bollinger Bands – Up
- Weekly Chart – Down
Overall Conclusion: Bearish Movement Expected
Alternative Scenario
On Thursday, from the 1.0483 level (yesterday's daily close), the market may initiate a downward move targeting 1.0438 – the 21-day EMA (thin black line). From this level, the price could reverse upward toward 1.0481 – the 14.6% retracement level (red dashed line).


