


Trend Analysis (Figure 1)
On Thursday, from the 1.2672 level (yesterday's daily close), the market may begin a downward movement, targeting 1.2637 – the 14.6% retracement level (red dashed line). From this level, the price may rebound upward toward 1.2727 – a historical support level (blue dashed line).
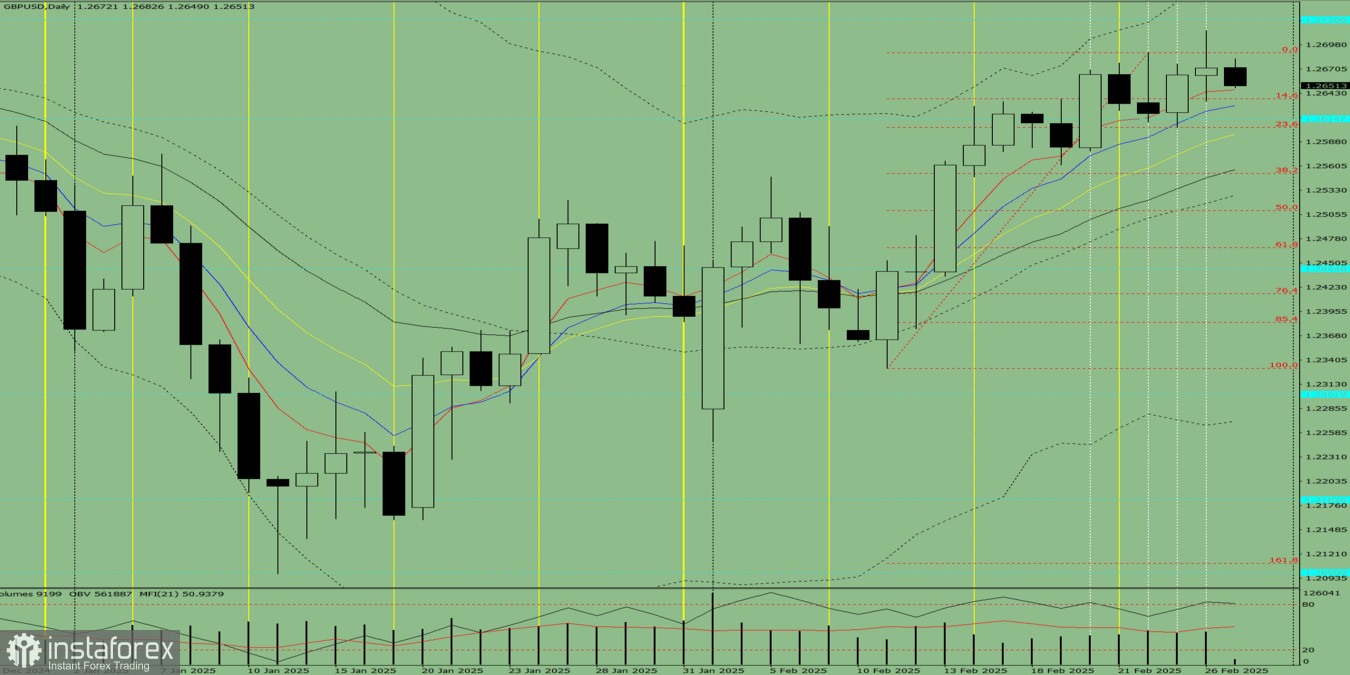
Figure 1: Daily Chart
Comprehensive Analysis Summary:
- Indicator Analysis – Down
- Fibonacci Levels – Down
- Volume Analysis – Down
- Candlestick Analysis – Down
- Trend Analysis – Up
- Bollinger Bands – Up
- Weekly Chart – Down
Overall Conclusion: Bearish Trend Expected
Alternative Scenario
From the 1.2672 level (yesterday's daily close), the market may begin a downward move, targeting 1.2604 – the 23.6% retracement level (red dashed line). From this level, the price may start moving upward toward 1.2637 – the 14.6% retracement level (red dashed line).


