


Trade Analysis and Recommendations for the Japanese Yen
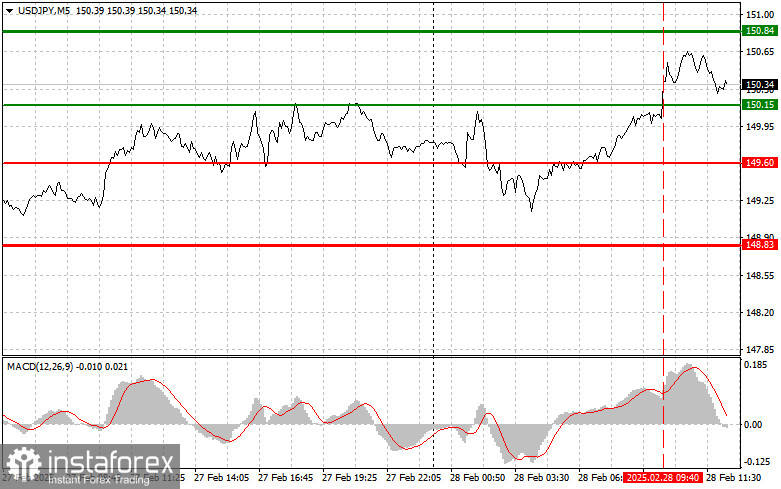
The test of 150.15 occurred when the MACD indicator had just started moving up from the zero mark, confirming the correct entry point for buying the dollar. As a result, the pair rose by 50 points.
Today, the second half of the trading day is packed with economic data, but the focus will be on the Core Personal Consumption Expenditures (PCE) Index. Stronger-than-expected personal spending data could indicate that inflation remains persistent, which would disrupt the Federal Reserve's plans for monetary easing. This scenario would likely force the Fed to maintain high interest rates at the next meeting, making the U.S. dollar more attractive to investors seeking yield. Conversely, weaker personal spending data could reinforce expectations of rate cuts, weakening the dollar. This makes today's economic releases critical for the short-term dynamics of the currency market.
For my intraday strategy, I will primarily focus on Scenario #1 and Scenario #2.
Buy Signal
Scenario #1: I plan to buy USD/JPY today if the price reaches 150.56 (green line on the chart), targeting a rise to 151.19. At 151.19, I will exit long positions and initiate short trades in the opposite direction, expecting a 30-35 point pullback. This trade assumes a bullish correction. Important! Before buying, confirm that the MACD indicator is above the zero mark and just starting to rise.
Scenario #2: Another buying opportunity will arise if the price tests 150.21 twice while the MACD indicator is in oversold territory. This will limit the pair's downward potential and trigger a reversal upward, targeting resistance levels of 150.56 and 151.19.
Sell Signal
Scenario #1: I plan to sell USD/JPY once it breaks below 150.21 (red line on the chart), expecting a quick decline. The key target for sellers will be 149.60, where I will exit short positions and immediately buy in the opposite direction, anticipating a 20-25 point rebound. Downward pressure on the pair could emerge at any moment today. Important! Before selling, confirm that the MACD indicator is below the zero mark and just beginning its downward movement.
Scenario #2: I will also consider selling USD/JPY if 150.56 is tested twice, while the MACD indicator is in overbought territory. This will limit the pair's upward potential and trigger a market reversal downward, with a target at 150.21 and 149.60.
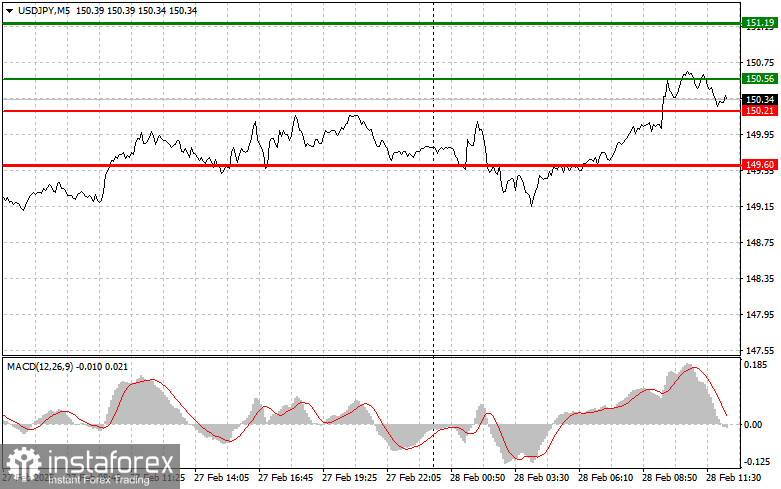
Chart Legend:
- Thin green line – entry price for buying the asset.
- Thick green line – expected price where Take Profit orders or manual profit-taking should be considered, as further growth above this level is unlikely.
- Thin red line – entry price for selling the asset.
- Thick red line – expected price where Take Profit orders or manual profit-taking should be considered, as further declines below this level are unlikely.
- MACD Indicator – essential for determining overbought and oversold market conditions.
Important: Beginner forex traders should exercise caution when making market entries. Before major fundamental reports, it is best to stay out of the market to avoid sudden price fluctuations. If trading during high-impact news releases, always use stop-loss orders to minimize potential losses. Without stop-loss protection, traders risk losing their entire deposit quickly, especially when trading large volumes without proper money management.
For successful trading, having a clear trading plan is crucial, as demonstrated in the strategies above. Spontaneous trading decisions based on market fluctuations often result in losses for intraday traders.


