


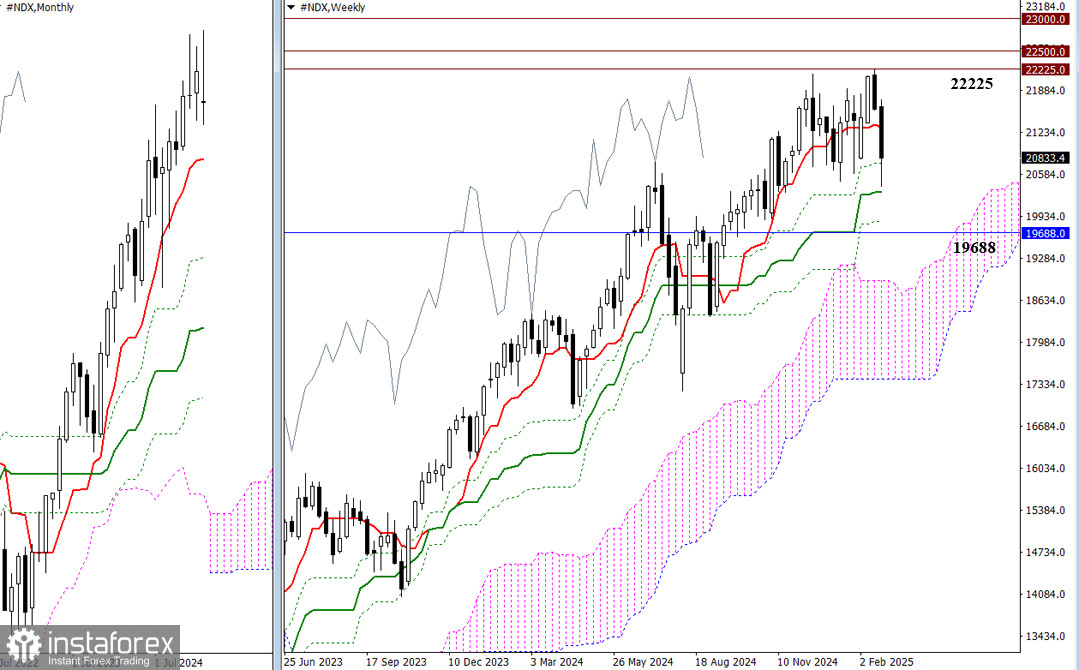
February marked a new all-time high at 22,225, but the bulls failed to hold and build on this level. The last two weeks of the month led to significant losses for the buyers. The market closed February with an indecision candle and nearly reached the support of the weekly medium-term trend at 20,306.5. Given the current conditions, the monthly downward correction is expected to continue toward its first target at 19,688, while the weekly golden cross may be invalidated at 19,853.80.
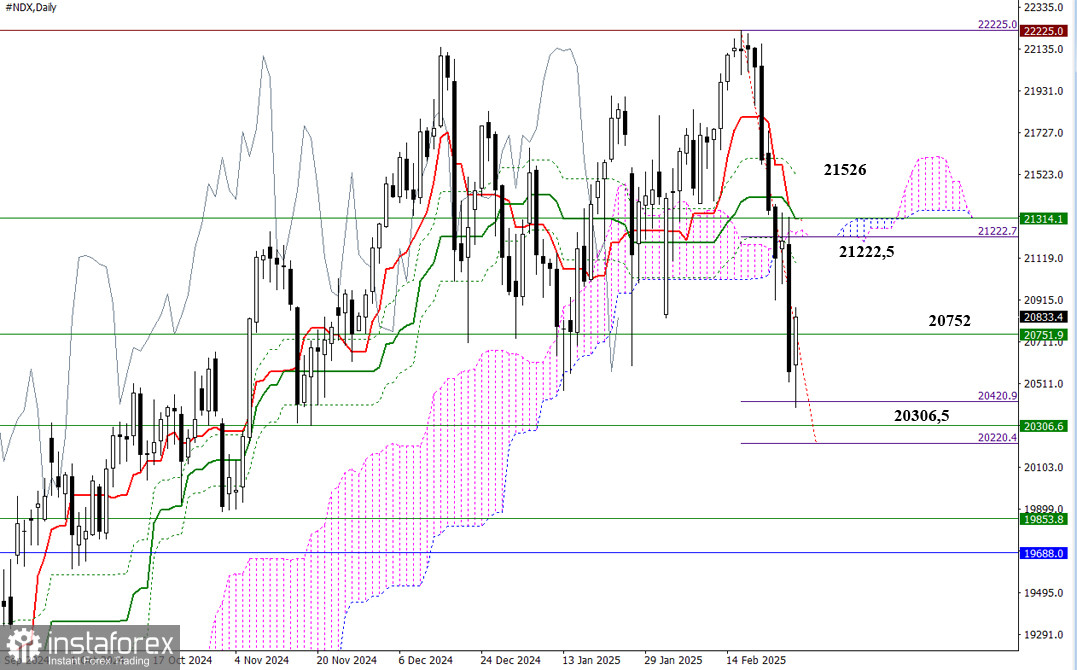
On the daily timeframe, the Ichimoku cloud was broken during the decline, forming a bearish target range of 20,420.9 – 20,220.4. The fulfillment of the first target at 20,420.9 led to a daily rebound. If the bulls continue to restore their positions, their main objective in this area will be to return to the bullish zone relative to the daily Ichimoku cloud at 21,222.5 and retest the broken daily Ichimoku cross at 21,094 – 21,302 – 21,526, aiming for a breakout. If the bears regain control, a breakdown below 20,220.4 and the weekly medium-term trend at 20,306.5 will open new downside prospects.
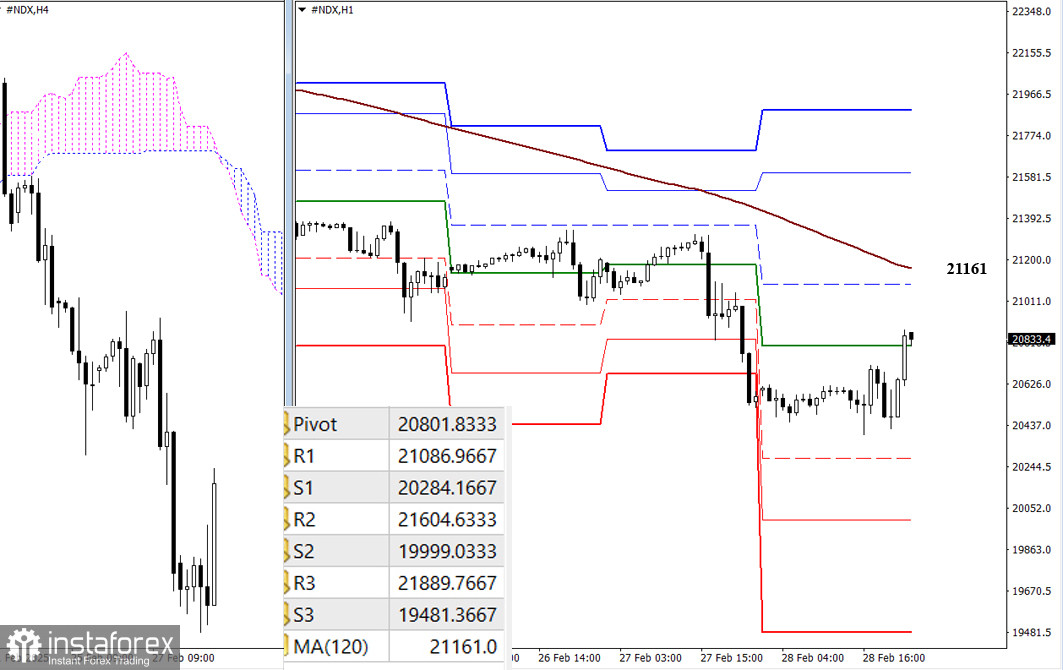
The daily rebound appears as an upward correction on lower timeframes. The bulls have tested the central pivot level of the day. The next correction target is the weekly long-term trend at 21,161, which determines the balance of power, and holding this trend provides a key advantage. Additional intraday reference points include classic pivot levels, which are updated daily when the market opens.
***
Technical Analysis Components:
- Higher Timeframes: Ichimoku Kinko Hyo (9.26.52) and Fibonacci Kijun levels
- H1: Classic Pivot Points and 120-period Moving Average (weekly long-term trend)


