


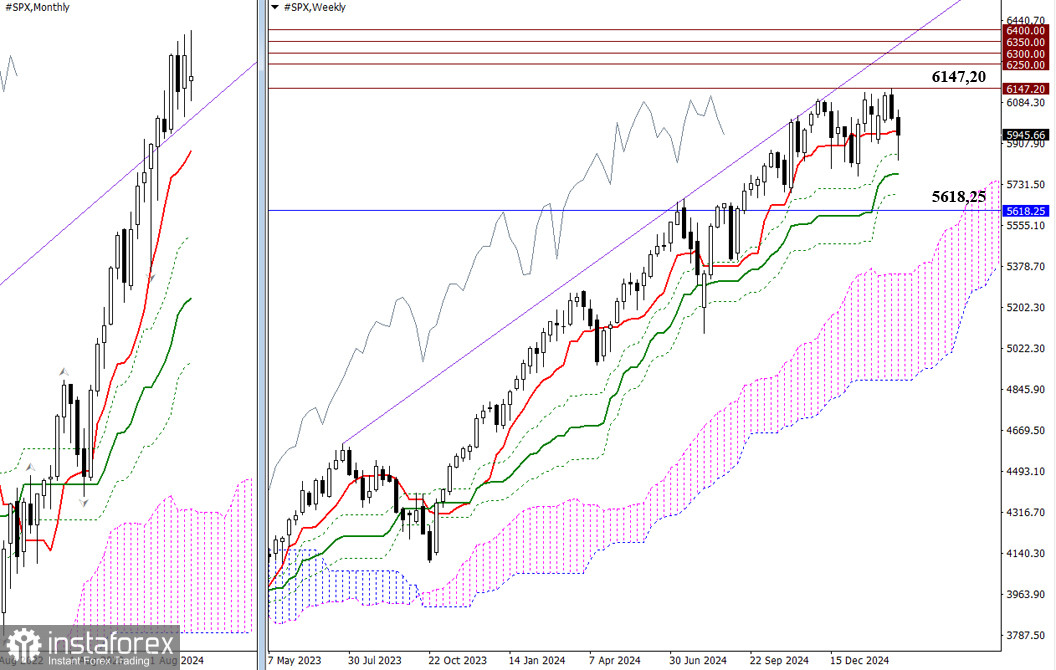
The past session marked not only the end of the trading week but also the month. February set a new high at 6,147.20 but failed to achieve more significant bullish gains. The final February candle signals uncertainty, creating conditions for a continued monthly downward correction. The nearest target on the monthly timeframe is the short-term trend, currently at 5,618.25. On the way to this level, the bears must test the support levels of the weekly Ichimoku golden cross at 5,774.49 – 5,686.52. A breakdown of the monthly short-term trend at 5,618.25 would invalidate the weekly golden cross, opening new downside opportunities for the bears.
If the bulls manage to hold their ground, an update to the current high at 6,147.20 would shift the focus toward psychological resistance levels at 6,250 – 6,300 – 6,350 – 6,400.
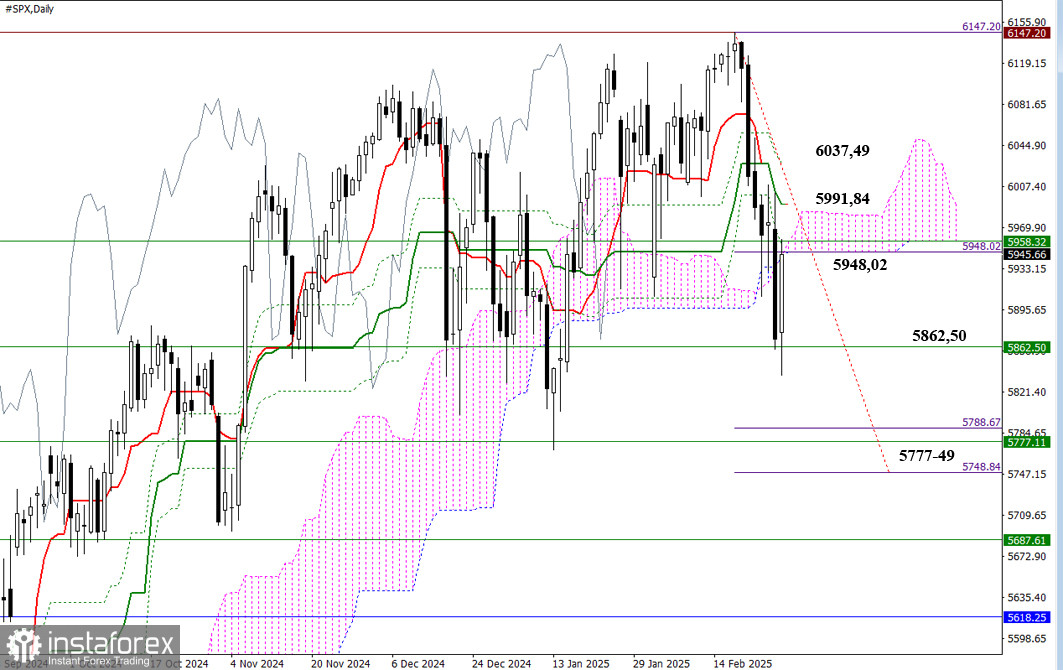
On the daily timeframe, the market is currently working on invalidating the daily cross and breaking the Ichimoku cloud at 5,948.02. If the bears continue the decline in the coming days and break weekly support at 5,862.50, the market will likely aim to fulfill the daily breakout target at 5,748.84 and test the weekly medium-term trend at 5,777.11. Alternatively, for the bulls to regain control, they need to re-enter the bullish zone relative to the daily cloud, retest the recently broken daily Ichimoku cross at 5,991.84 – 6,037.49, and consolidate above these resistance levels.
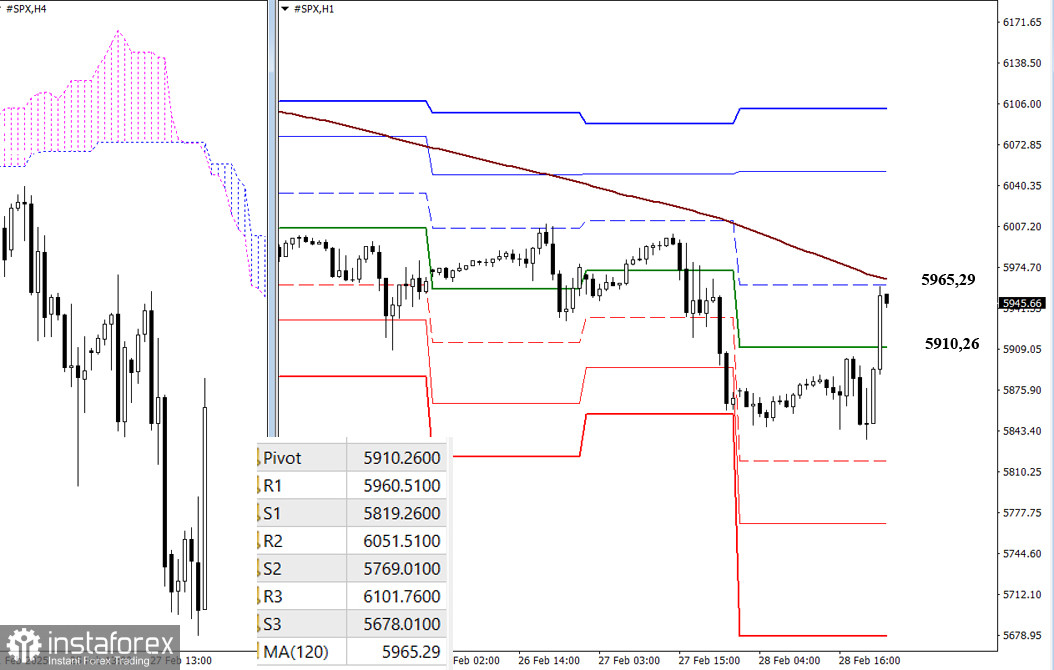
On lower timeframes, the market has closely approached the weekly long-term trend at 5,965.29. The coming trading week may start with a test of this level, which could determine the market's direction. This is the most critical level on lower timeframes, as holding above it favors bullish momentum, with intraday upside targets aligned with classic pivot resistance levels. Conversely, a rejection and move below this level could trigger bearish sentiment, with classic pivot support levels acting as downside targets. These pivot values are updated daily when trading opens.
***
Technical Analysis Components:
- Higher Timeframes: Ichimoku Kinko Hyo (9.26.52) and Fibonacci Kijun levels
- H1: Classic Pivot Points and 120-period Moving Average (weekly long-term trend)


