


Trend Analysis (Fig. 1)
On Wednesday, the market may start a downward movement from 1.0910 (yesterday's closing level), targeting 1.0861 – the 14.6% retracement level (blue dashed line). If this level is tested, an upward retracement toward 1.0947 (upper fractal, blue dashed line) may follow.
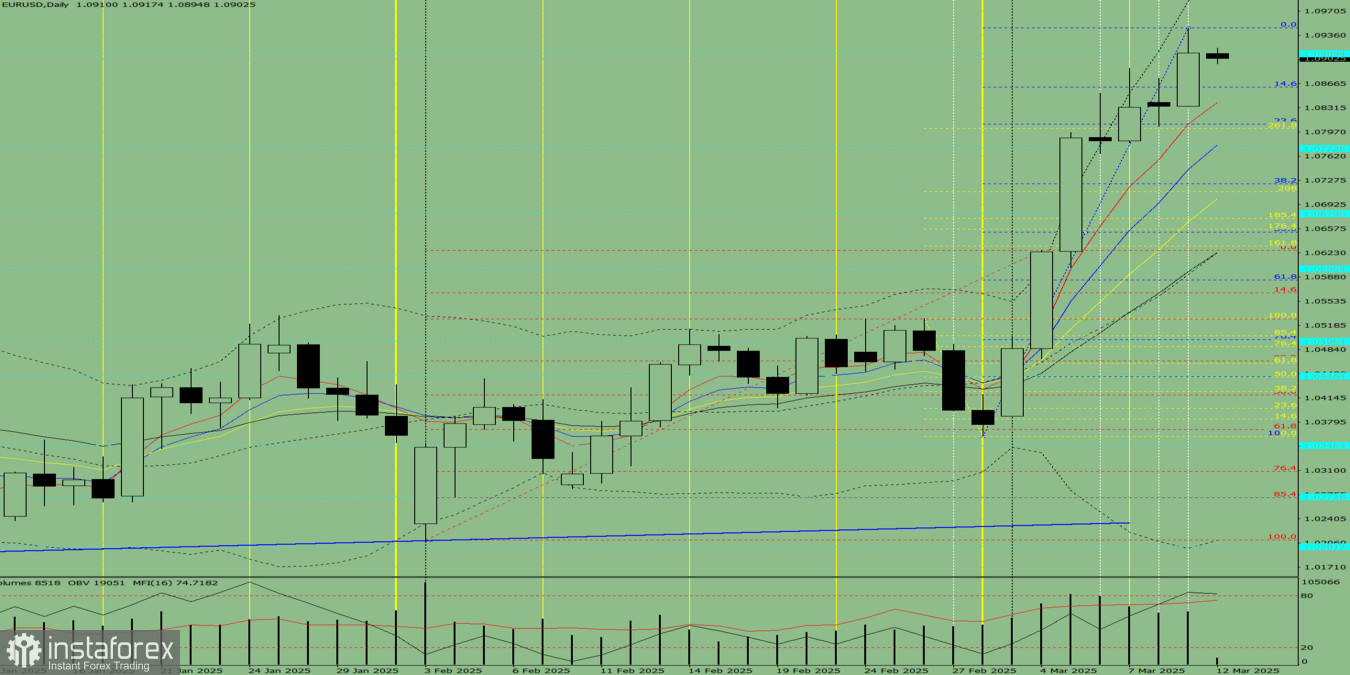
Fig. 1 (Daily Chart)
Comprehensive Analysis:
- Indicator Analysis – Bearish
- Fibonacci Levels – Bearish
- Volume Analysis – Bearish
- Candlestick Analysis – Bearish
- Trend Analysis – Bearish
- Bollinger Bands – Bearish
- Weekly Chart – Bearish
General Conclusion:
A downward trend is expected.
Alternative Scenario:
If the price moves down from 1.0910, the next target will be 1.0808 – the 23.6% retracement level (blue dashed line). If this level is tested, an upward retracement toward 1.0861 (14.6% retracement) may follow.


