


Trend Analysis (Figure 1).
On Wednesday, the market may begin moving downward from the 1.2942 level (previous daily close), targeting 1.2905—the 14.6% retracement level (yellow dashed line). Upon testing this level, the price may rebound upwards, aiming for 1.2977—resistance line (bold blue line).
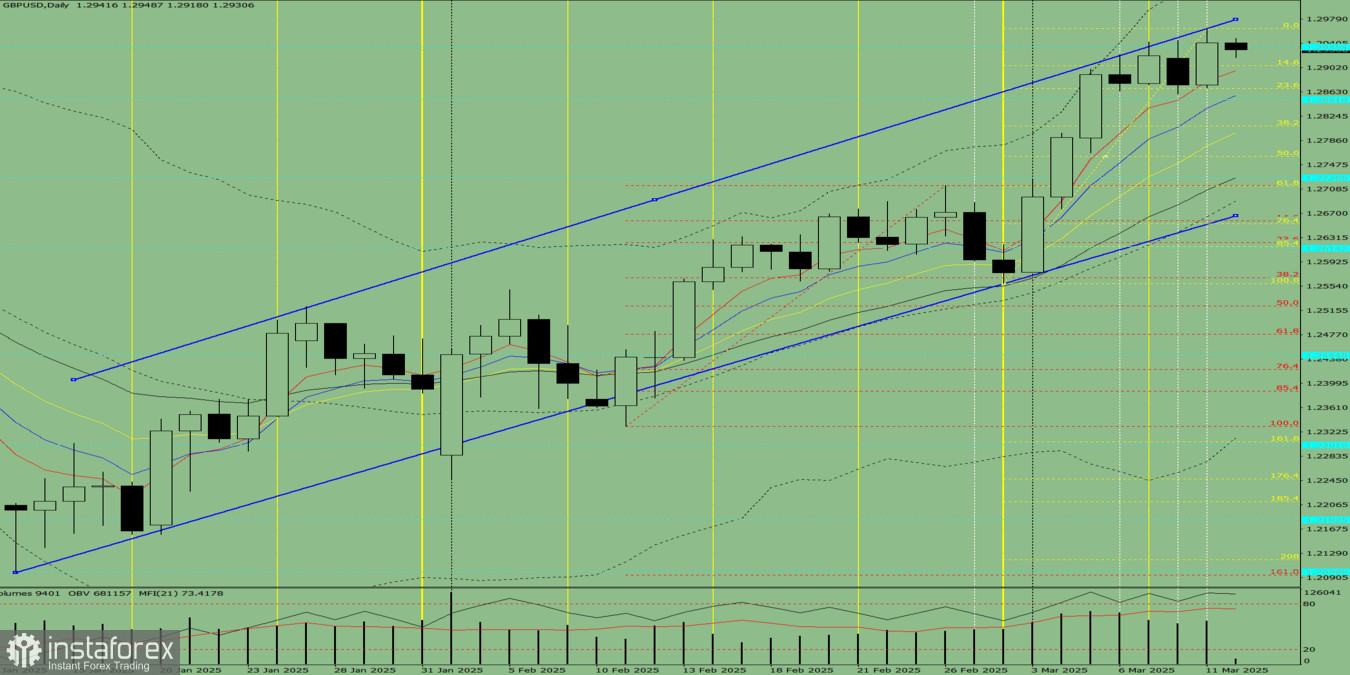
Figure 1 (Daily Chart).
Comprehensive Analysis:
- Indicator analysis – bearish
- Fibonacci levels – bearish
- Volume analysis – bearish
- Candlestick analysis – bearish
- Trend analysis – bearish
- Bollinger Bands – bearish
- Weekly chart – bearish
General Conclusion: Bearish Trend
Alternative Scenario: If the market starts declining from the 1.2942 level, it may target 1.2868 (23.6% retracement level, yellow dashed line). If this level is tested, the price may rebound upwards toward 1.2977—resistance line (bold blue line).


