


GBP/USD
Analysis:
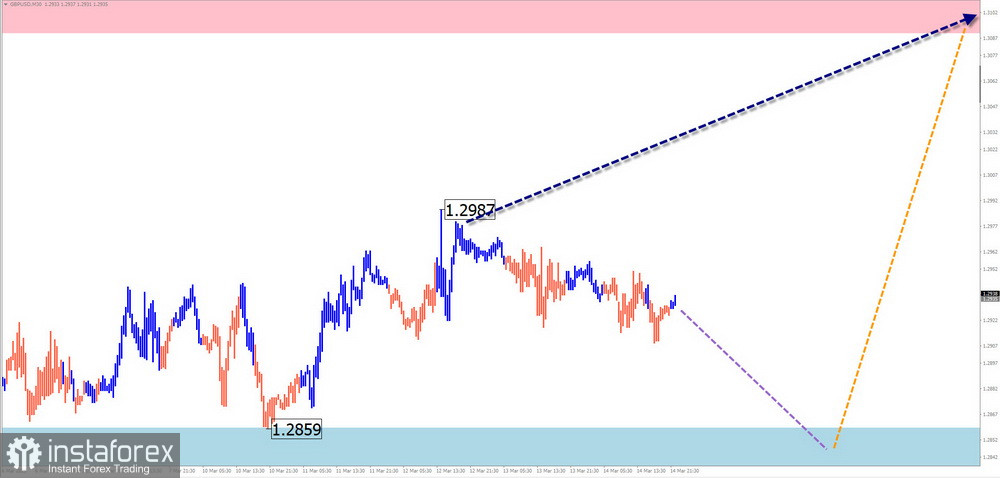
Since January, an upward wave has been forming on the GBP/USD chart. The wave structure analysis shows that this wave remains incomplete. After breaking through another resistance level, the price is now near its upper boundary, forming an intermediate correction, which is still ongoing. There are no immediate reversal signals visible on the chart.
Forecast:
In the coming days, the pair is expected to continue moving sideways. A short-term decline toward support levels is possible, followed by a potential reversal in the second half of the week, leading to price recovery toward the resistance zone. A brief breach of the lower boundary of the projected support zone during the trend shift cannot be ruled out.
Potential Reversal Zones:
Resistance:
- 1.3090/1.3140
Support:
- 1.2860/1.2810
Recommendations:
- Sell: Limited potential, high-risk trading.
- Buy: Should be considered only after confirmed reversal signals appear in the support zone.
AUD/USD
Analysis:
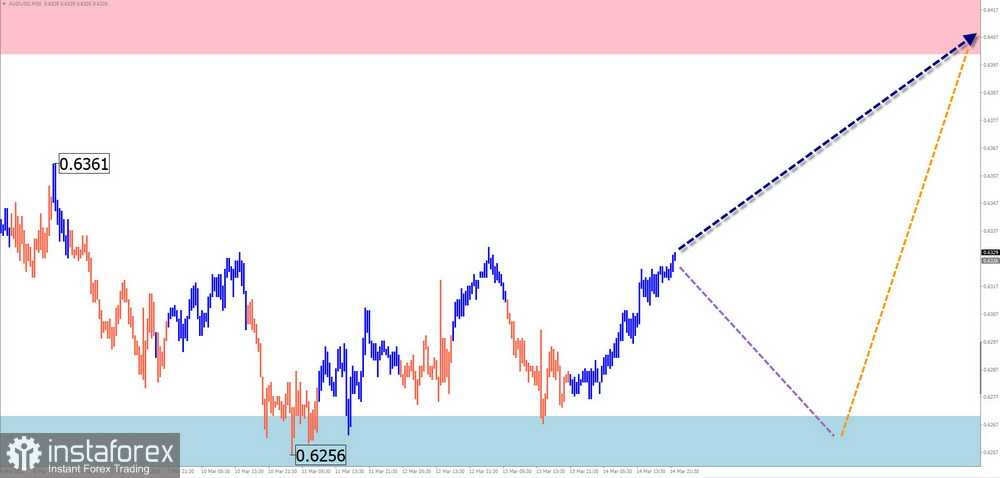
The bullish wave that began in September of last year has been setting the main direction for AUD/USD. The price highs and lows form a "pennant" pattern on the chart. The wave structure indicates the formation of a corrective pullback within the final part (C). No clear reversal signals are visible on the chart.
Forecast:
In the coming days, the pair is expected to continue moving sideways. A temporary decline toward the support zone is possible. By the end of the week, the probability of a trend reversal and renewed price growth increases. However, the weekly growth potential is limited by the resistance zone.
Potential Reversal Zones:
Resistance:
- 0.6400/0.6450
Support:
- 0.6260/0.6210
Recommendations:
- Buy: Not advisable until confirmed reversal signals appear in the support zone.
- Sell: Limited potential. Lower trade volume and restrict trade duration to intraday sessions for safety.
USD/CHF
Analysis:
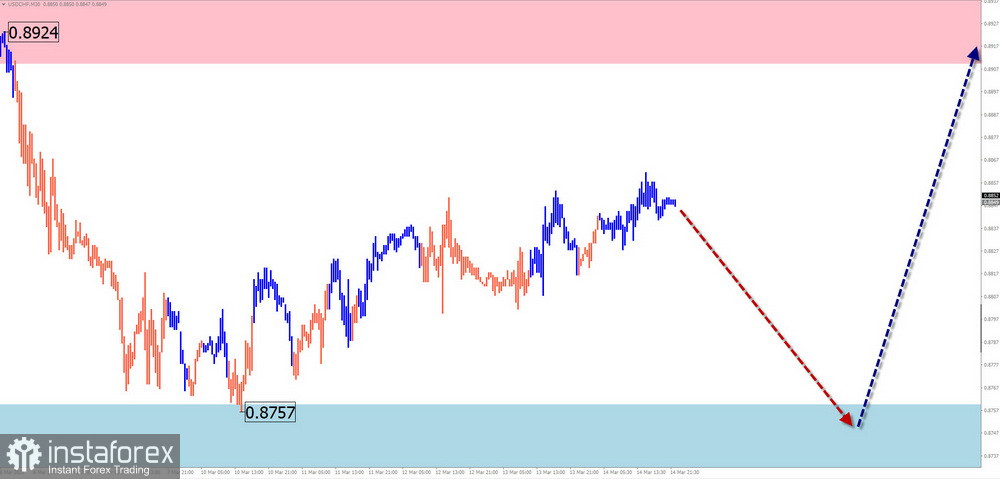
The bullish wave from August 5, 2023, continues to define the short-term price movement for USD/CHF. However, since the beginning of this year, the pair has entered a downward correction. The price has now reached the upper boundary of a wide potential reversal zone on the weekly timeframe.
Forecast:
In the coming days, the general downward trend is expected to continue, with the price gradually moving toward the support zone. By the end of the week, a trend reversal and price recovery toward resistance levels is possible.
Potential Reversal Zones:
Resistance:
- 0.8910/0.8960
Support:
- 0.8760/0.8710
Recommendations:
- Sell: Possible with fractional volume sizes within individual trading sessions.
- Buy: Should be considered only after confirmed reversal signals appear in the support zone.
EUR/JPY
Analysis:
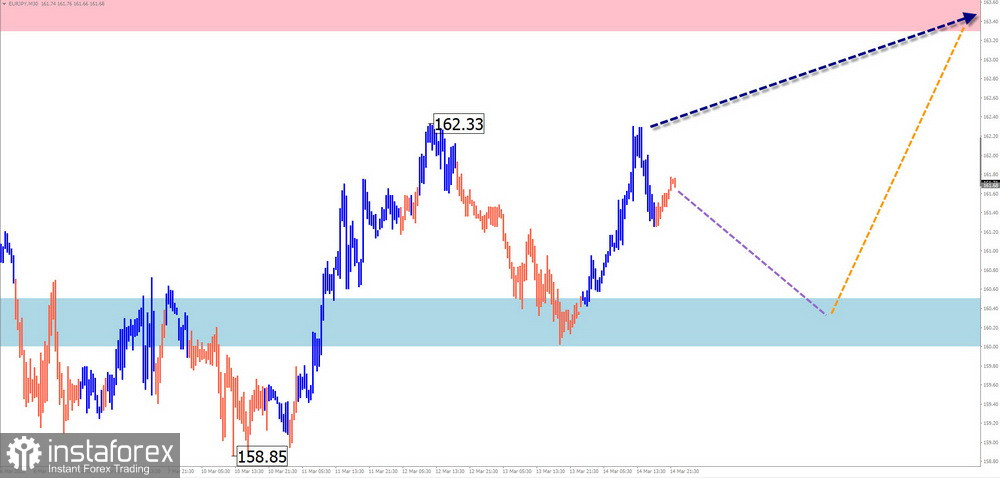
Since late February, the EUR/JPY pair has been in a short-term uptrend. Since last week, the unfinished segment of the wave from February 22 has been forming a correction. The price rebounded from the lower boundary of strong resistance on the weekly timeframe.
Forecast:
Next week, EUR/JPY is likely to continue moving sideways. In the next few days, a short-term pullback downward cannot be ruled out. In the second half of the week, a reversal near the support zone and a resumption of price growth are expected. Price increases could reach the resistance zone.
Potential Reversal Zones:
Resistance:
- 163.30/163.80
Support:
- 160.50/160.00
Recommendations:
- Buy: Should be considered only after confirmed reversal signals appear in the support zone.
- Sell: Possible with a reduced trade volume within individual trading sessions. Limited potential due to strong support.
#Ethereum
Analysis:
Since mid-December of last year, Ethereum has been following a downward trend. The current segment of this wave has been developing since March 3. After breaking through an intermediate support level, the price shifted into a sideways movement, forming a corrective pattern. Once the correction is complete, the final part (C) of the downtrend is expected to continue.
Forecast:
During the upcoming week, Ethereum is expected to continue its overall downward movement. Over the next few days, sideways movement is likely, though a short-term price increase cannot be ruled out. Near the resistance zone, a trend reversal and renewed decline toward the support zone are expected.
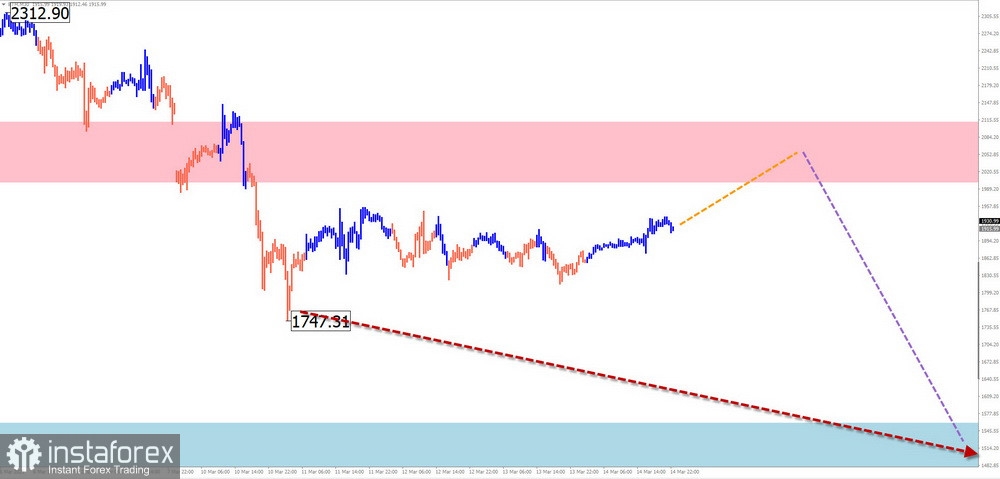
Potential Reversal Zones:
Resistance:
- 2000.0/2050.0
Support:
- 1560.0/1510.0
Recommendations:
- Buy: Possible with fractional volumes within intraday sessions, but growth potential is limited by resistance.
- Sell: Should be considered only after confirmed reversal signals appear in the resistance zone.
#Litecoin
Analysis:
Since December of last year, Litecoin has been forming a downward wave. Its structure resembles an extended flat pattern. While this wave now appears complete, no clear reversal signals are visible on the chart. The price is currently within a strong potential reversal zone on the daily timeframe.
Forecast:
In the coming days, Litecoin is expected to gradually decline toward the support zone. A short-term test of the lower boundary of support cannot be ruled out. Following this, a reversal and change in price direction are expected. The resistance zone represents the most likely area for short-term growth this week.
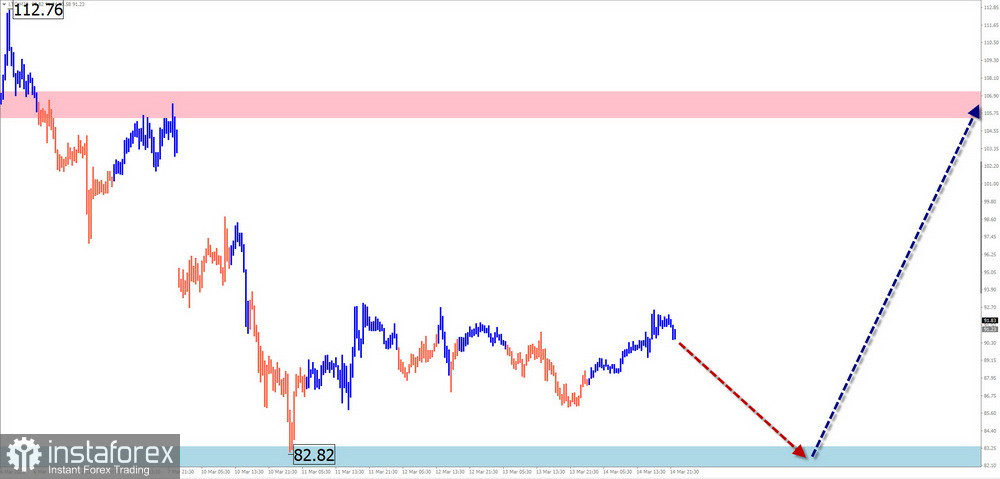
Potential Reversal Zones:
Resistance:
- 105.60/106.60
Support:
- 83.50/82.50
Recommendations:
- Sell: High-risk, low potential trades.
- Buy: Should be considered only after confirmed reversal signals appear in the support zone based on your trading system.
Explanation of Simplified Wave Analysis (SWA):
All waves consist of three parts (A-B-C). Only the last unfinished wave is analyzed on each timeframe. Dashed lines indicate expected price movements.
Important Note: The wave algorithm does not account for the duration of price movements over time.


