


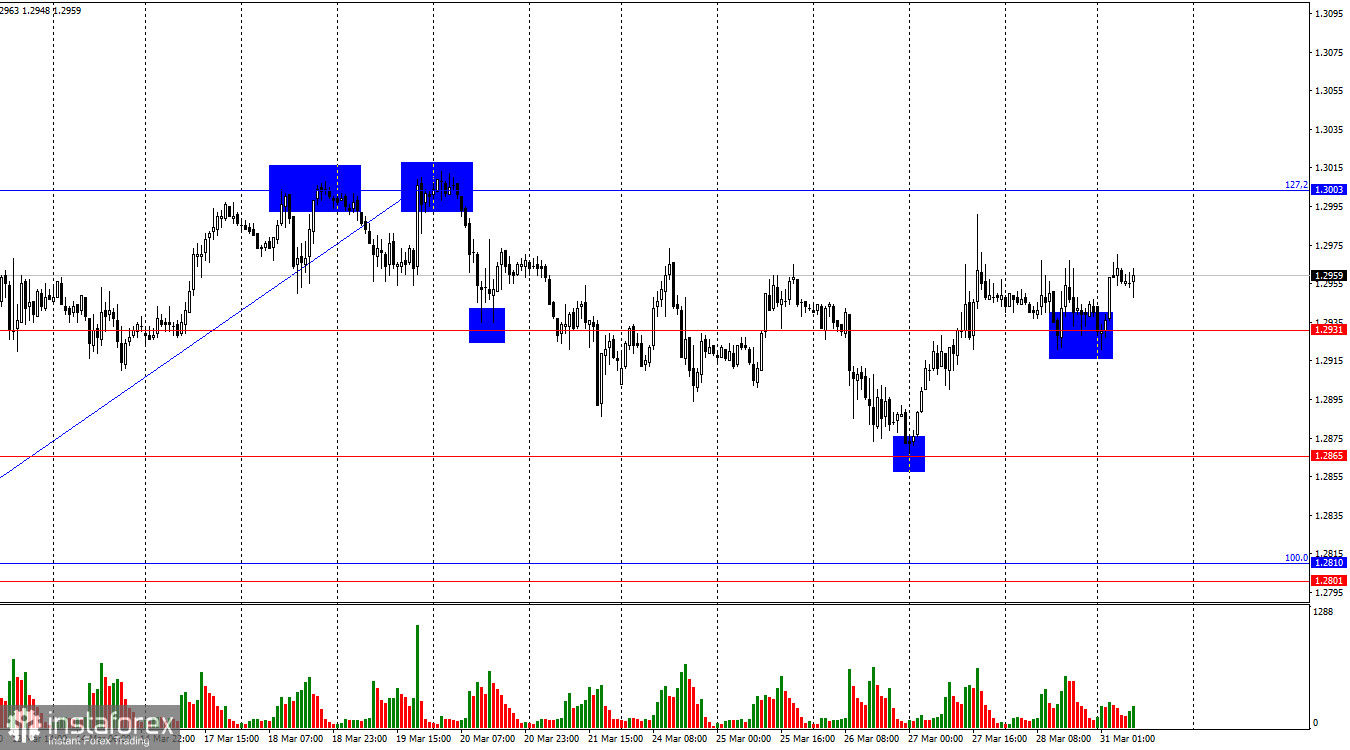
On the hourly chart, the GBP/USD pair traded sideways on Friday, but two rebounds from the 1.2931 level allow for some potential growth toward the 127.2% Fibonacci corrective level at 1.3003. A rebound from this level would favor the US dollar and lead to a decline toward the 1.2931 level. A close above 1.3003 would end the sideways trend.
The wave structure is completely clear. The last completed downward wave did not break the previous low, while the most recent upward wave broke the previous high. Thus, a bullish trend is currently forming. The pound has shown strong growth recently, despite the fact that the news background was not strong enough to justify such aggressive buying. However, most traders are unwilling to buy the dollar regardless of the economic data, as Donald Trump continues to introduce new tariffs, which are expected to negatively impact US and global economic growth in the future.
Friday's news background was relatively favorable for the bulls. They didn't manage to significantly improve their positions but didn't lose any ground either. The key data came from GDP and retail sales reports. GDP didn't disappoint (as it could have), and retail sales rose by 1% m/m and 2.2% y/y, which exceeded traders' expectations. Thus, even on days when the pound can't continue its rally, bears still fail to capitalize—or don't even try. Let me remind you that Donald Trump is also responsible for the pound's rise. The pound itself doesn't have many reasons to grow steadily over the past couple of months. As for the dollar, while it also lacks strong bearish drivers, the single factor known as "Trump" outweighs all others combined. I believe that even this week, US economic data will not matter as much as Trump's potential announcement of new tariffs, which could come as early as the day after tomorrow.
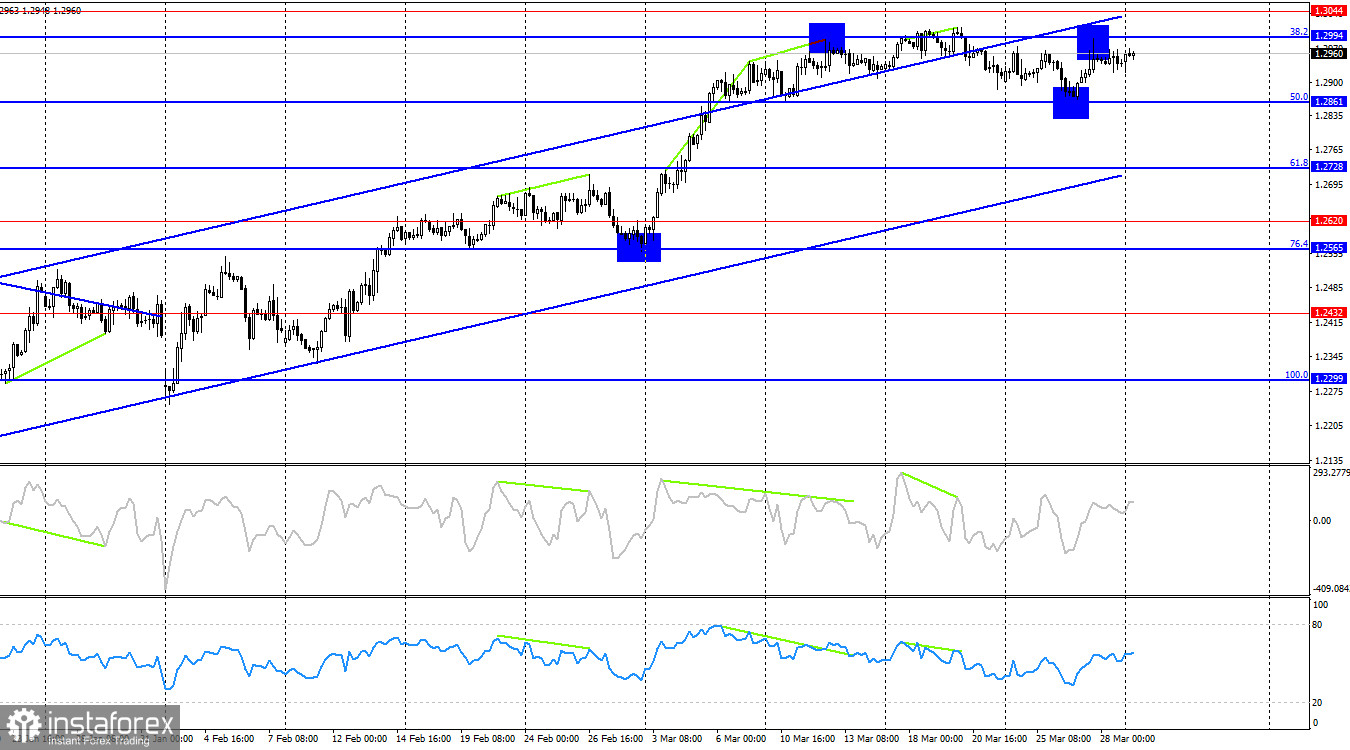
On the 4-hour chart, the pair continues to move upward. I don't expect a strong decline in the pound until the quotes fall below the ascending channel. A rebound from the 38.2% Fibonacci level at 1.2994 will again favor the US dollar and lead to a decline toward the 50.0% corrective level at 1.2861. In my view, the recent pullback has been too weak to consider the bullish trend over. A firm close above 1.2994 will increase the likelihood of further growth.
Commitments of Traders (COT) Report:
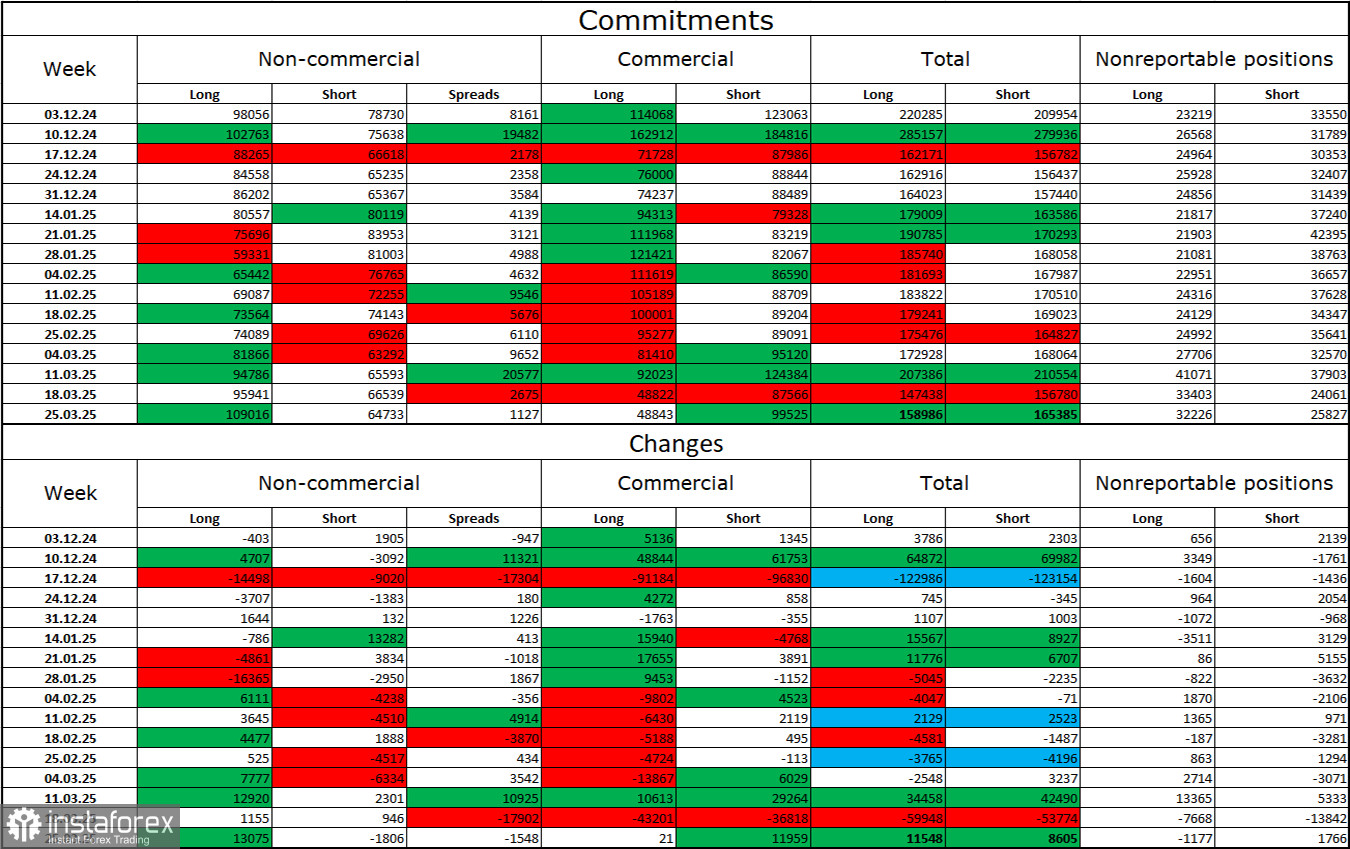
The sentiment among the "Non-commercial" trader category became more bullish last week. The number of Long positions held by speculators increased by 13,075, while Short positions decreased by 1,806. Bears have lost their advantage in the market. The gap between Long and Short positions now stands at nearly 44,000 in favor of the bulls: 109,000 vs. 65,000.
In my view, the pound still has downside potential, but recent developments may lead to a long-term market reversal. Over the past three months, Long positions have increased from 98,000 to 109,000, while Shorts have dropped from 78,000 to 65,000. More importantly, over the last eight weeks, Longs have grown from 59,000 to 109,000, and Shorts have fallen from 81,000 to 65,000. Let me remind you—these have been "eight weeks of Trump's rule"...
Economic calendar for the US and UK:
US – Chicago PMI (13:45 UTC)
On Monday, the economic calendar contains only one entry, which is unlikely to attract much attention. The news background is not expected to influence market sentiment significantly today.
GBP/USD Forecast and Trader Tips:
Short positions may be considered upon a new rebound from the 1.3003 level on the hourly chart, with targets at 1.2931 and 1.2865, as the pair remains in a sideways range. Long positions were possible upon a close above 1.2931 on the hourly chart or a rebound from 1.2865. At present, the movement is nearly horizontal, making it difficult for bulls to secure a foothold above 1.3003.
Fibonacci levels are plotted from 1.2809–1.2100 on the hourly chart and from 1.2299–1.3432 on the 4-hour chart.


