


Trade Breakdown and Tips for Trading the Japanese Yen
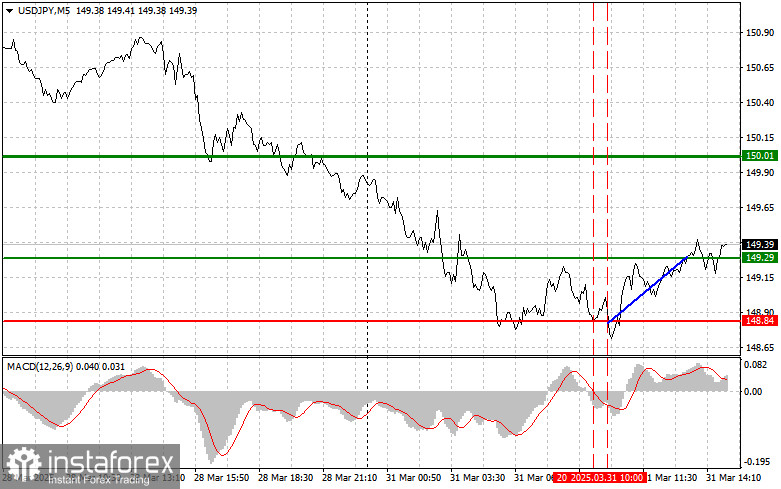
The price test at 148.84 occurred when the MACD had already moved significantly below the zero mark, limiting the pair's downward potential. A short time later, another test of 148.84 took place when the MACD was in oversold territory, which allowed Scenario #2 for a buy trade to be executed. As a result, the dollar rose by more than 40 points.
The Chicago PMI is what traders are awaiting in the second half of the day. The Chicago PMI, or the Chicago Business Activity Index, is an economic indicator reflecting the health of the manufacturing sector in the Chicago region. It provides data on production activity, new orders, employment, inventories, and prices. A reading above 50 indicates expansion in the manufacturing sector, while below 50 points to contraction. If the data exceeds expectations, the USD/JPY pair may rise.
However, domestic factors in Japan's economy should also be considered. Despite a long period of deflation, signs of growing price pressure have recently emerged, which could influence the Bank of Japan's decisions on interest rates and their potential hikes. These expectations have been driving the yen's medium-term uptrend against the dollar since January.
As for intraday strategy, I will mainly rely on the implementation of Scenarios #1 and #2.
Buy Signal
Scenario #1: I plan to buy USD/JPY today upon reaching the entry point around 149.55 (green line on the chart), targeting a rise to 150.11 (thicker green line). Around 150.11, I will exit long positions and switch to short trades (expecting a 30–35 point move in the opposite direction). The pair's growth can be expected as part of a bullish correction.Important: Before buying, make sure the MACD is above the zero mark and just beginning to rise from it.
Scenario #2: I also plan to buy USD/JPY today if there are two consecutive tests of the 149.15 level, while the MACD is in oversold territory. This will limit the pair's downward potential and may trigger a market reversal to the upside. A rise toward the opposite levels of 149.55 and 150.11 can be expected.
Sell Signal
Scenario #1: I plan to sell USD/JPY after a break below 149.15 (red line on the chart), which should lead to a quick decline. The key target for sellers will be 148.55, where I will exit short positions and immediately open long positions in the opposite direction (expecting a 20–25 point rebound from that level). Downward pressure on the pair is possible at any moment today.Important: Before selling, make sure the MACD is below the zero mark and just beginning to decline from it.
Scenario #2: I also plan to sell USD/JPY today in the case of two consecutive tests of 149.55, while the MACD is in overbought territory. This would limit the pair's upward potential and may lead to a downward market reversal. A decline toward the opposite levels of 149.15 and 148.55 can be expected.
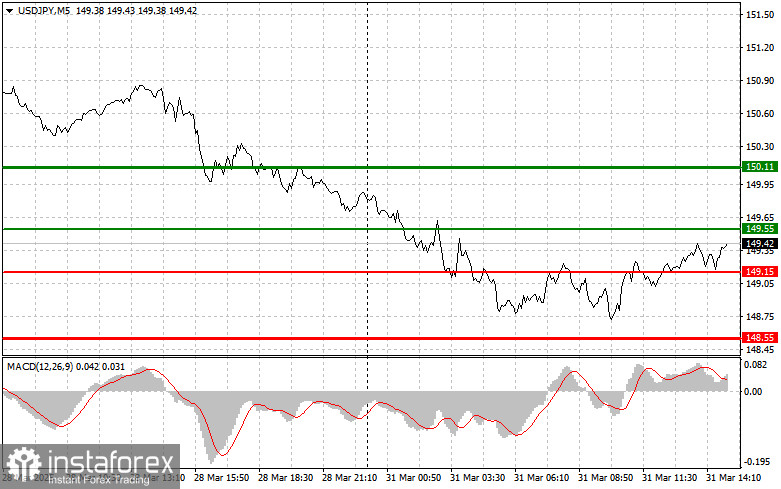
Chart Key:
- Thin green line – entry price for buying the instrument
- Thick green line – suggested Take Profit or manual profit-fix level, as growth beyond it is unlikely
- Thin red line – entry price for selling the instrument
- Thick red line – suggested Take Profit or manual profit-fix level, as further decline beyond it is unlikely
- MACD Indicator – it's important to follow overbought and oversold zones when entering the market
Important: Beginner Forex traders must be extremely cautious when entering the market. It's best to stay out of trades ahead of major fundamental reports to avoid getting caught in sharp price swings. If you choose to trade during news releases, always set stop-loss orders to minimize losses. Without stop-losses, you could quickly lose your entire deposit, especially if you're not using proper money management and are trading large volumes.
And remember, successful trading requires a clear trading plan like the one presented above. Making spontaneous trading decisions based on the current market situation is a losing strategy for any intraday trader.


