


Analysis of Thursday's Trades
1H Chart of GBP/USD
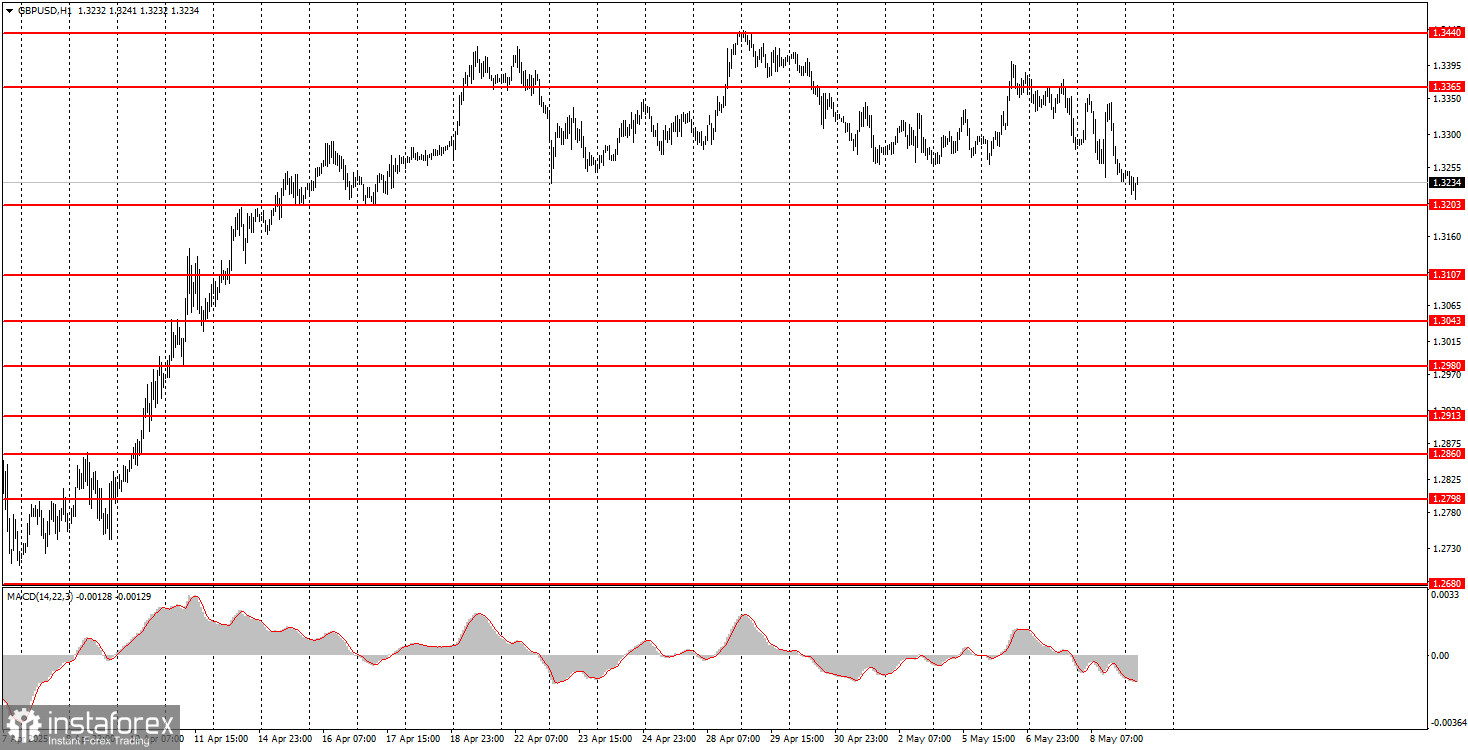
On Thursday, the GBP/USD pair continued its choppy decline within the sideways channel and failed to break out, unlike the EUR/USD pair. From our perspective, the British pound had twice as many reasons to fall as the euro. First, the Federal Reserve meeting can be considered hawkish since the market expected Powell to signal a resumption of monetary easing in 2025, but those statements never came. Second, the Bank of England decided to cut the interest rate, and two members of the Monetary Policy Committee even voted for a 0.5% cut. Since this BoE decision had not been priced in beforehand (as often happens), the pound should have fallen on Thursday. Therefore, we were supposed to see a decline in the pair both on Wednesday and Thursday—and we did, but it was so weak that it wasn't enough to break out of the sideways range. It's also worth noting that Trump announced signing a trade deal with the UK, but no details have been provided.
5M Chart of GBP/USD
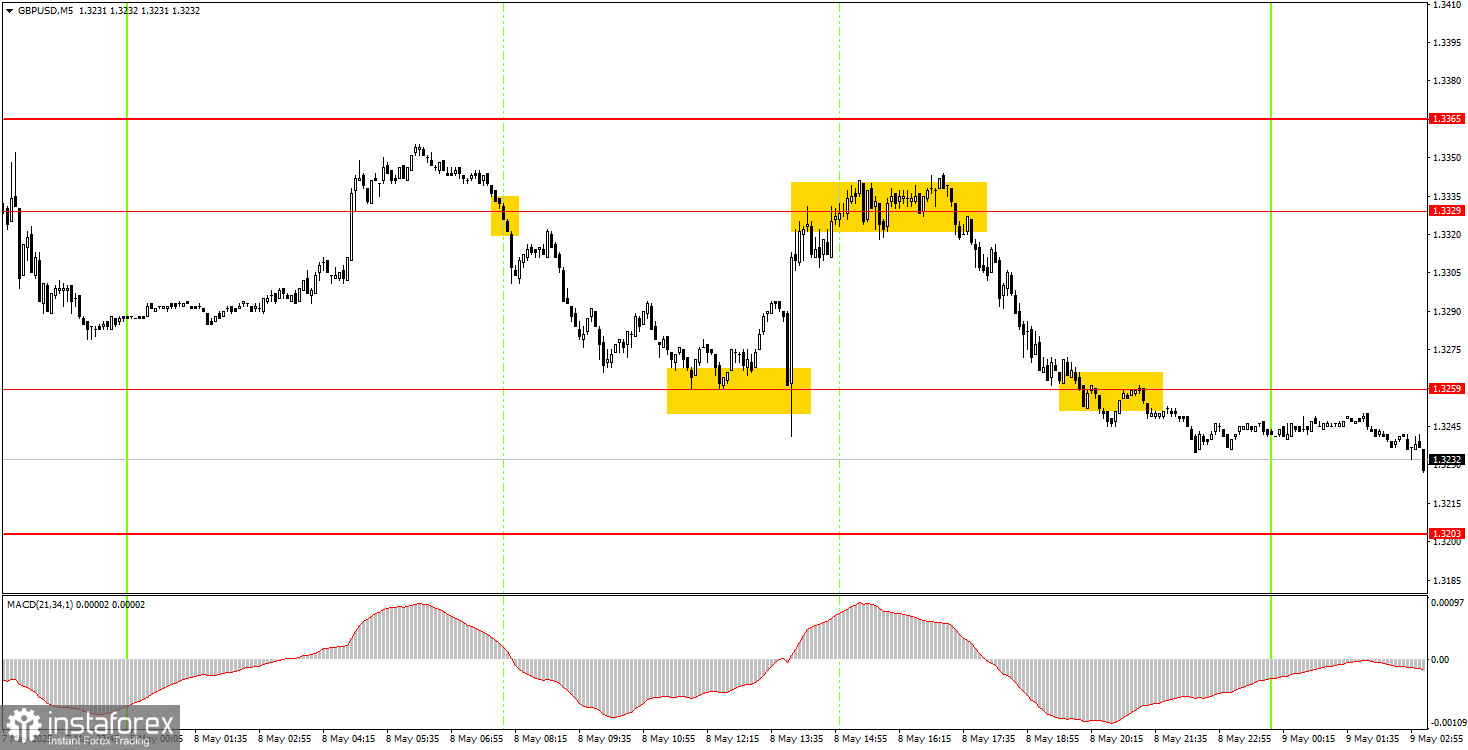
Surprisingly, in the 5-minute time frame, the pair traded fairly technically on Thursday, despite constantly shifting direction. The first sell signal near the 1.3329 level was profitable, as was the triple bounce from the 1.3259 level during the BoE meeting announcement. A third sell signal near 1.3329 was somewhat unclear but ultimately led to the nearest target being met. These three signals could have yielded about 120–130 pips in profit.
Trading Strategy for Friday:
In the hourly time frame, the GBP/USD pair continues to follow Trump's lead, which is why the British pound remains steadily high, or at least refuses to drop. The pair cannot exit the sideways channel, the market only responds partially to fundamentals, and macroeconomic data is ignored. Therefore, if the pound breaks out of the range, a dollar strengthening may follow, at least on technical grounds. We still see the pound being very reluctant to give up positions.
The GBP/USD pair may move in either direction on Friday, as it remains within the sideways channel. The Fed and BoE meetings supported the dollar, but this hasn't helped the dollar much overall. Incidentally, the dollar should strengthen on news of the trade deal between the UK and the US, not weaken. If the dollar fell on tariff introductions, it should rise on conflict resolution.
On the 5-minute time frame, you can currently trade at the following levels: 1.2848–1.2860, 1.2913, 1.2980–1.2993, 1.3043, 1.3102–1.3107, 1.3145–1.3167, 1.3203, 1.3259, 1.3329, 1.3365, 1.3421–1.3440, 1.3488, 1.3537, 1.3580–1.3598. On Friday, BoE Governor Andrew Bailey will speak in the UK, but we don't expect any significant statements, as the results of the BoE meeting were just announced yesterday.
Core Trading System Rules:
- Signal Strength: The shorter the time it takes for a signal to form (a rebound or breakout), the stronger the signal.
- False Signals: If two or more trades near a level result in false signals, subsequent signals from that level should be ignored.
- Flat Markets: In flat conditions, pairs may generate many false signals or none at all. It's better to stop trading at the first signs of a flat market.
- Trading Hours: Open trades between the start of the European session and the middle of the US session, then manually close all trades.
- MACD Signals: On the hourly timeframe, trade MACD signals only during periods of good volatility and a clear trend confirmed by trendlines or trend channels.
- Close Levels: If two levels are too close (5–20 pips apart), treat them as a support or resistance zone.
- Stop Loss: Set a Stop Loss to breakeven after the price moves 20 pips in the desired direction.
Key Chart Elements:
Support and Resistance Levels: These are target levels for opening or closing positions and can also serve as points for placing Take Profit orders.
Red Lines: Channels or trendlines indicating the current trend and the preferred direction for trading.
MACD Indicator (14,22,3): A histogram and signal line used as a supplementary source of trading signals.
Important Events and Reports: These are found in the economic calendar and can heavily influence price movements. Therefore, during their release, you should trade as cautiously as possible or exit the market to avoid a sharp reversal of the price against the previous movement.
Note for Beginner Forex Traders: Not every trade can be profitable. Developing a clear strategy and sound money management is key to long-term success in trading.


